Bitcoin Price Forecast: BTC aiming for $95,000 as Global M2 money supply surges
- Bitcoin price trades slightly above $85,500 on Tuesday after a recovery of nearly 7% the previous week.
- The rising Global M2 money supply could be a positive sign for Gold and Bitcoin.
- Traders should be cautious as Coinglass data shows significant liquidity around $85,800, which, if reached, could bring volatility.

Bitcoin (BTC) price edges higher and trades slightly above $85,500 at the time of writing on Tuesday after recovering nearly 7% the previous week. The rising Global M2 money supply could be a favorable signal for both Gold and Bitcoin. Traders should be cautious, as Coinglass data shows significant liquidity around $85,800, which, if reached, could bring volatility.
Bitcoin could rally amid rising Global M2 money supply
According to the MacroMicro chart below, the total money supply in the United States (US), the Euro area, Japan, and China reached $90.21 trillion in February and has been constantly rising since the start of this year. Historical data shows that Bitcoin’s price has often moved in tandem with M2 growth.
During the first half of 2020, when favoring economic policies and stimulus packages caused global money printing, Bitcoin prices skyrocketed from $10,000 to $69,000. Moreover, when M2 reached a new record of $89.7 trillion in October 2024, the report suggested a rally in Bitcoin prices. Such a condition has generally seen Gold and Bitcoin prices rally in the long term. As Gold prices hit a new all-time high of $3,245 on Friday, analysts predict that Bitcoin could follow the rally soon.
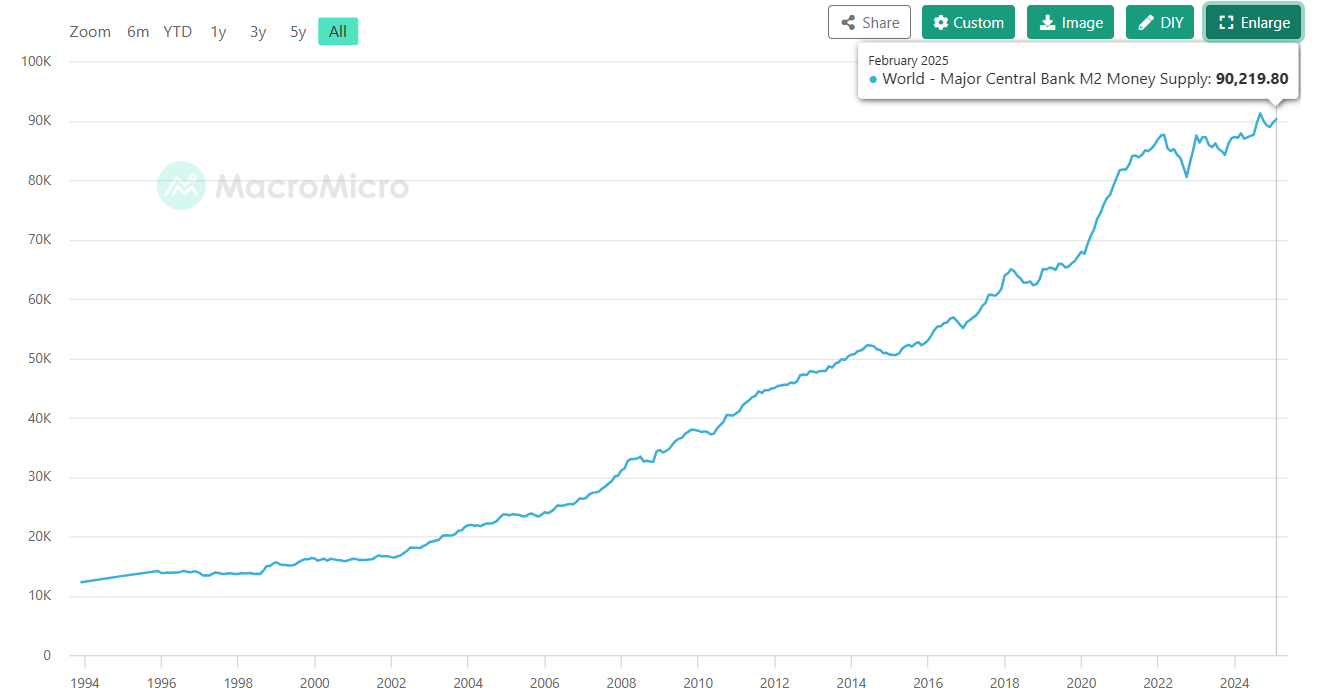
World - Major Central Bank M2 Money Supply chart. Source: MacroMicro
Analyst Colin explains in his X post that in the correlation between global M2 money supply and Bitcoin price, when testing offsets from 30 to 130 days, the 107-day offset shows the highest correlation (81.5% over one year), suggesting M2 changes predict BTC price movements with a lag.
The analyst further explains that a potential BTC price “blast-off” around April 30, based on the 107-day offset, would reflect historical patterns where increased global liquidity — often from central banks lowering rates or buying bonds — drives risk assets like BTC higher.
Global M2 Money Supply predictive correlation to Bitcoin price movements
— Colin Talks Crypto 🪙 (@ColinTCrypto) March 17, 2025
In an effort to have maximum accuracy with the correlation, I have calculated all the most-suggested scenarios of various M2 offsets, and here are the mathematical results.
It is irrefutable.
I will now… pic.twitter.com/qe9lVYKvSX
Liquidity at 85,800 could bring volatility in BTC
Conglass’s Bitcoin liquidation heatmap data shows significant liquidity of around $85,800, which indicates a high concentration of stop or limit orders that could trigger sharp price movements. Traders should be cautious, as a liquidity zone like this could bring volatility and trigger liquidations.
There is a lot of liquidity around $85800.🤣https://t.co/z9WYoWpH6h https://t.co/ZpD7lcFJHa pic.twitter.com/Imv0m60XJc
— CoinGlass (@coinglass_com) April 14, 2025
According to the CrypoQuant report, if the price of Bitcoin continues to rally, it could find resistance at the $96,000 zone. This level represents the Trader Realized Price (violet solid line). This price level has acted as price support during this bull cycle but can now act as price resistance if bullish conditions don’t continue to improve. This has been the case in past bearish cycles.
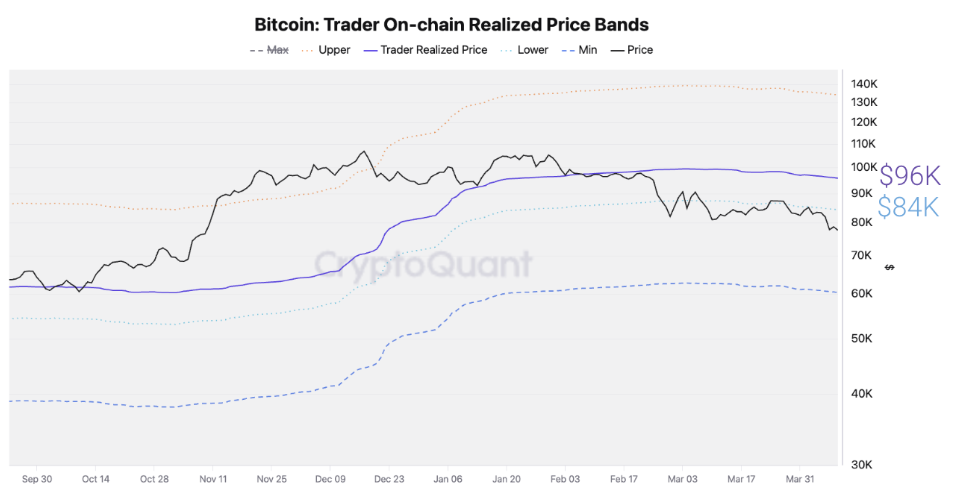
Bitcoin: Trader On-chain Realized Price Bands chart. Source: CryptoQuant
Bitcoin Price Forecast: BTC on the verge of a breakout
Bitcoin price broke and closed above a descending trendline (drawn by connecting multiple highs since mid-January) on Friday and rallied 2.22% the next day. However, on Sunday, BTC faced rejection at the $85,000 level, which coincides with the 200-day Exponential Moving Average (EMA) and the daily resistance level. On Monday, BTC closed above the $84,500 level. At the time of writing on Tuesday, BTC trades above at around $85,500, breaking the aforementioned resistance levels.
If BTC closes above $85,000 on a daily basis, it could extend the rally to the key psychological level of $90,000. A successful close above this level could extend an additional rally to test its March 2 high of $95,000.
The Relative Strength Index (RSI) on the daily chart reads 53, pointing upward above its neutral level of 50, indicating bullish momentum. The Moving Average Convergence Divergence (MACD) indicator also showed a bullish crossover last week, giving a buy signal and indicating an upward trend. It also shows a rising histogram above its neutral zero level, suggesting bullish momentum.
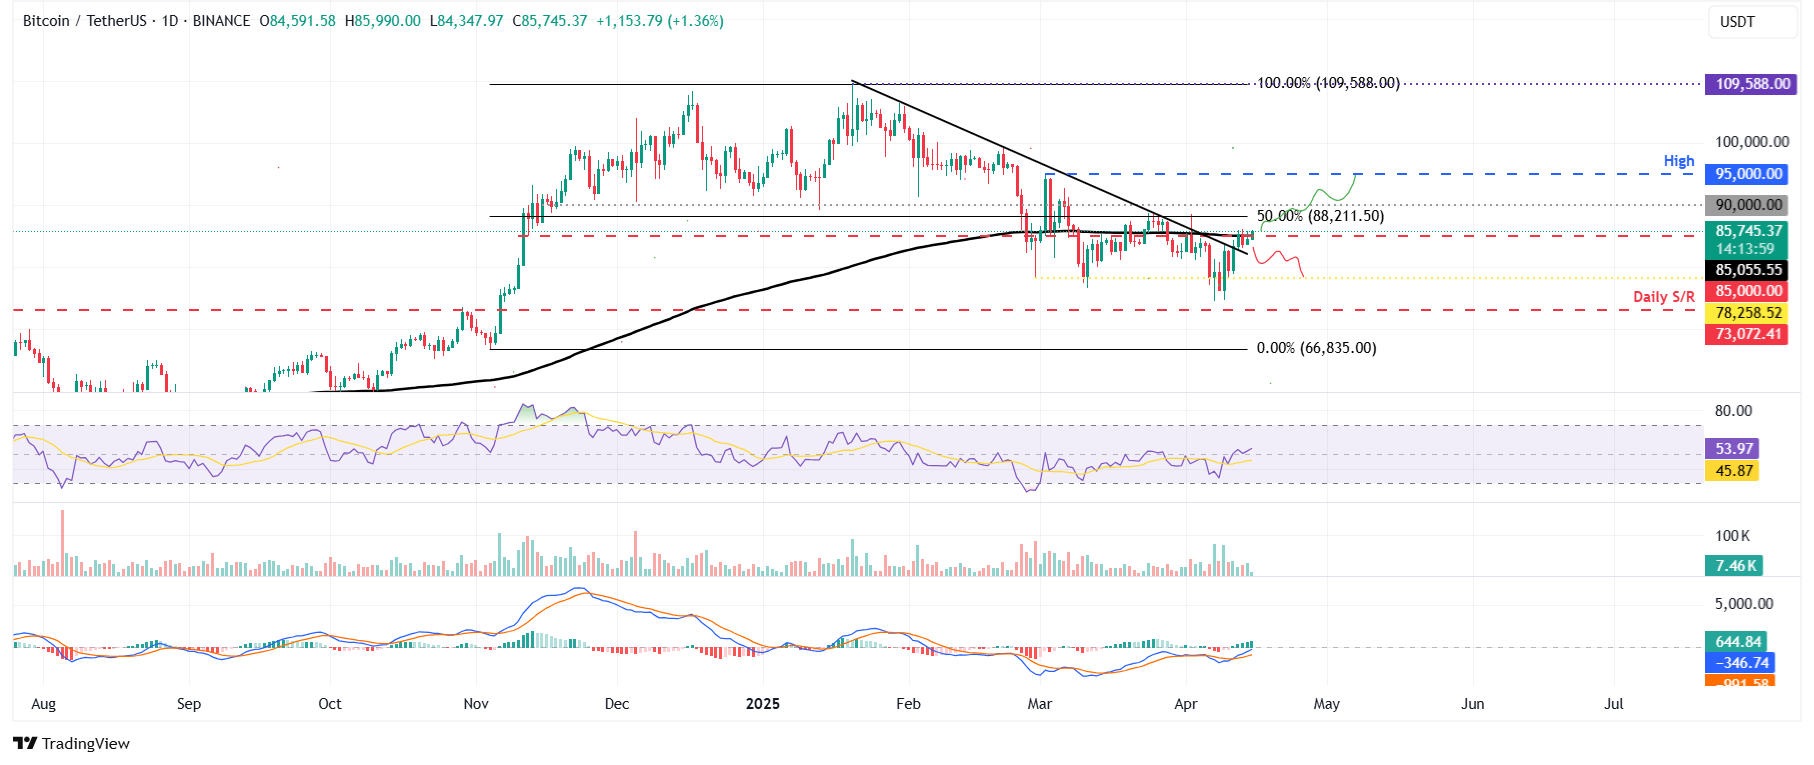
BTC/USDT daily chart
However, if BTC fails to close above $85,000 and continues its downward trend, it could extend the decline to retest its next daily support level at $78,258.
Bitcoin, altcoins, stablecoins FAQs
Bitcoin is the largest cryptocurrency by market capitalization, a virtual currency designed to serve as money. This form of payment cannot be controlled by any one person, group, or entity, which eliminates the need for third-party participation during financial transactions.
Altcoins are any cryptocurrency apart from Bitcoin, but some also regard Ethereum as a non-altcoin because it is from these two cryptocurrencies that forking happens. If this is true, then Litecoin is the first altcoin, forked from the Bitcoin protocol and, therefore, an “improved” version of it.
Stablecoins are cryptocurrencies designed to have a stable price, with their value backed by a reserve of the asset it represents. To achieve this, the value of any one stablecoin is pegged to a commodity or financial instrument, such as the US Dollar (USD), with its supply regulated by an algorithm or demand. The main goal of stablecoins is to provide an on/off-ramp for investors willing to trade and invest in cryptocurrencies. Stablecoins also allow investors to store value since cryptocurrencies, in general, are subject to volatility.
Bitcoin dominance is the ratio of Bitcoin's market capitalization to the total market capitalization of all cryptocurrencies combined. It provides a clear picture of Bitcoin’s interest among investors. A high BTC dominance typically happens before and during a bull run, in which investors resort to investing in relatively stable and high market capitalization cryptocurrency like Bitcoin. A drop in BTC dominance usually means that investors are moving their capital and/or profits to altcoins in a quest for higher returns, which usually triggers an explosion of altcoin rallies.
Author

Manish Chhetri
FXStreet
Manish Chhetri is a crypto specialist with over four years of experience in the cryptocurrency industry.


