Bitcoin price drastic rise to $31,000 by December 2020 – exploring the BTC S2F model
- Bitcoin halving effect is yet to kick in according to the S2F model popularized by PlanB.
- Bitcoin S2F model predicts the parabolic rise of BTC to $18,000 by October and $31,000 by December 2020.

The bellwether cryptocurrency Bitcoin has generally been on an upswing since the Coronavirus-triggered breakdown in March (of course, the frequent dips notwithstanding). Amid the recovery came the third mining reward having on May 11, 2020.
Understanding Bitcoin halving and its impact on the price
Bitcoin halving is an event integrated into the BTC blockchain code that ensures that its mining rewards are slashed into half every four years. Halving is key to ensuring that the coin's inflation is controlled and that the BTC correctly hits the 21 million maximum supply.
Speculation around halving tends to keep investors and cryptocurrency enthusiasts on edge, mainly supported by the first two halving events (2012 and 2016). In both of the events, Bitcoin eventually rallied to hit new all-time highs.
Unfortunately, the halving in May 2020 failed to rally the price upwards, as was expected. Many analysts and investors are reducing the halving to a “non-event.” Speculation surrounding halving developed due to the decrease in the number of coins coming into the market hence lower supply. Demand tends to increase after halving. Subsequently, if supply remains constant or decrease, a rippled effect is expected to push the price higher.
Was the 2020 Bitcoin halving a “non-event?”
The impact of the halving has either been delayed or ignored entirely. Many key figures and analysts said that times have changed since the first two events; hence little impact was expected. The Head of Business Development and Sales at Matrixport, a platform for cryptoassets financial services, Cynthia Wu told CoinDesk around the halving time:
Halving was already priced in, and the cryptocurrency could trade in the range of $8,000 to $10,000 in the near term.
Indeed there was a halving craze following the crash in March when Bitcoin traded lows of $3,800. However, the impact could not push significantly past $10,000 leading to somewhat sideways trading between $8,000 and $9,500.
Over the past couple of months, the flagship cryptocurrency has broken several resistance zones, including $10,000, $11,000, and $12,000. A new yearly was also traded around $12,500 before the uptrend was gagged under $12,000. On Tuesday, September 8, Bitcoin is trading at $10,275 after recovery from a dip to $9,900.
How likely is Bitcoin hitting $18,000 by October?
The Bitcoin Stock-to-flow (S2F) model, mainly popularized by a renowned analyst, PlanB gives a clear outline of where BTC price is heading. The model regards Bitcoin as other traditional assets; gold and silver. The S2F rations are utilized to evaluate a commodity's prevailing stock (current total supply) against its production (BTC's rate is being mined). A higher ratio means that the commodity (BTC) is getting scarcer and likely to increase in value in the future.
Bitcoin S2F chart
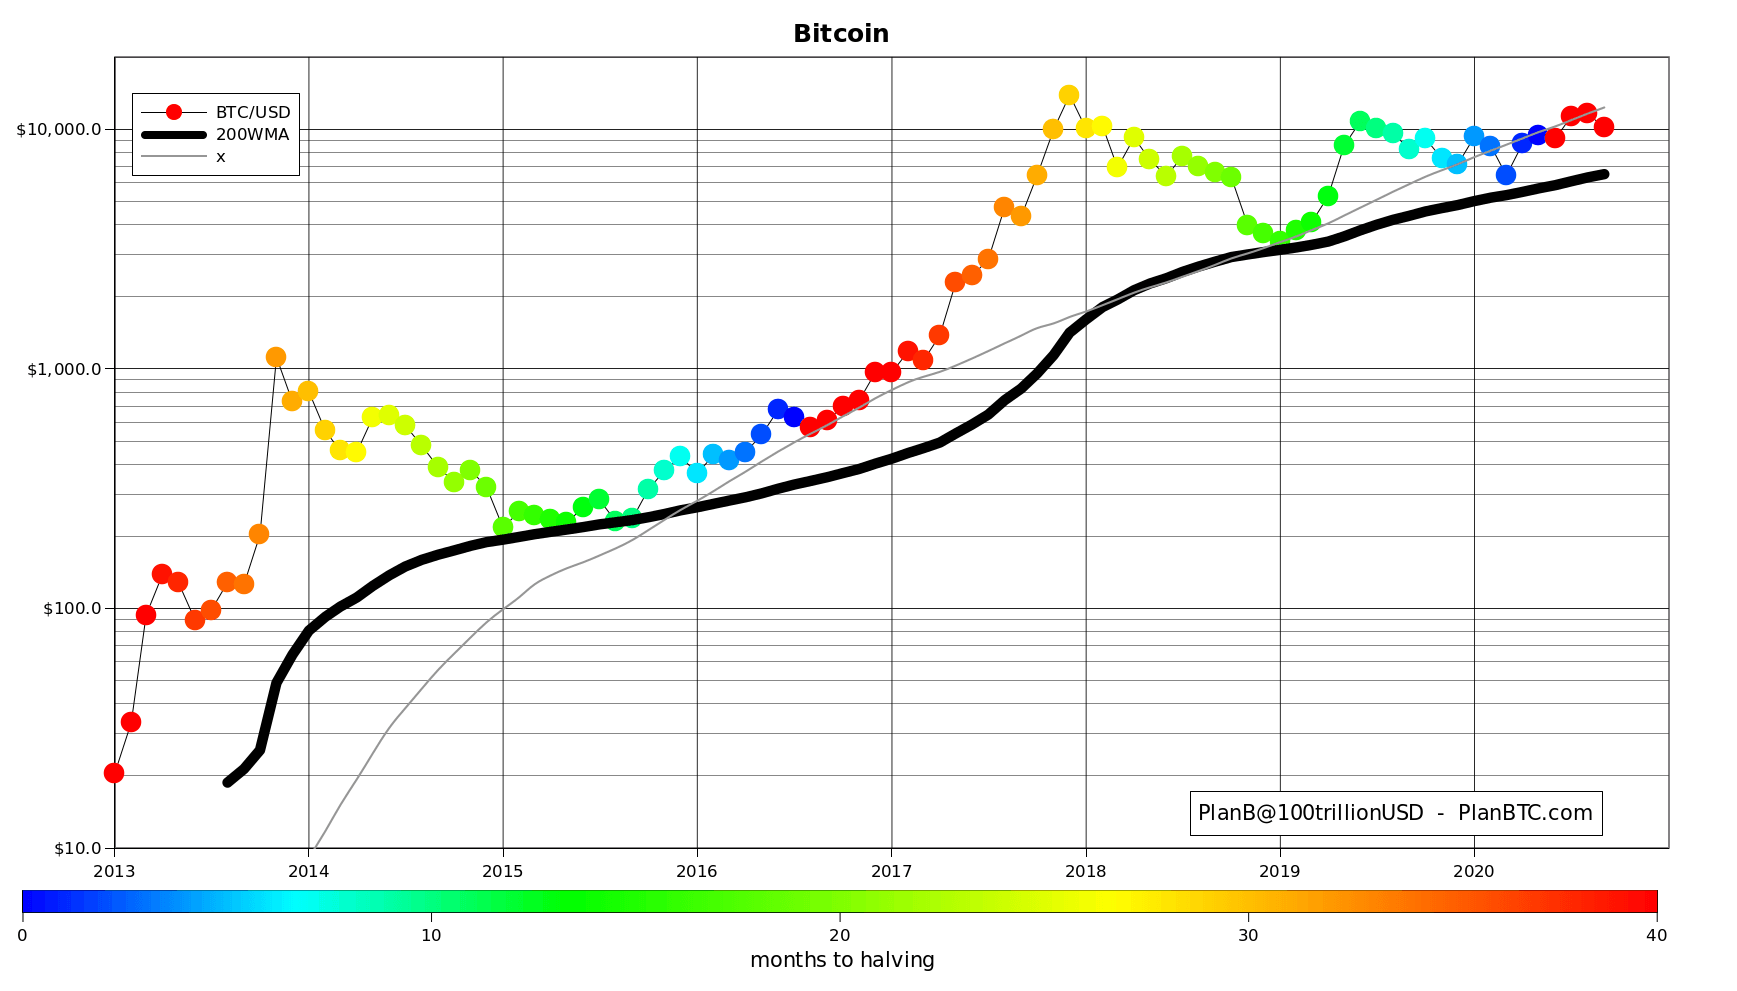
PlanB, alongside the S2F model believers, believes that the halving effect is yet to Bitcoin. Bit Harington highlights that after the halving in 2016, Bitcoin took about nine-ten months to hit its previous ATH at $1,200. On hitting this level, FOMO, otherwise referred to as the fear of missing out, kicked in, leading to the parabolic rally in late 2017 to $20,000.
After the second Bitcoin halving we had to wait 9/10 months to finally crush ATH again ($1200). And that's when the real fomo pump started. If the S2F price model is real, and I believe it is, it's definitely possible we have to wait for 5/6 more months to reach ATH/$20K.
— Bit Harington (@bitharington) September 7, 2020
pic.twitter.com/U3OhMXzQZv
Bitcoin S2F model has been used to predict massive growth for the leading cryptoasset. Some people now believe BTC can hit $18,000 by October 2020 and $31,000 by December 2020. According to PlanB, BTC has maintained steady growth over the last three months, closing June at $9,132, July at $11,356, and August at $11,665.
$11880 (Sept actual)
— PlanB (@100trillionUSD) September 1, 2020
$11655 (Aug close)
$11356 (July close)
$9132 (June close)#Bitcoin .. like clockwork pic.twitter.com/VjVk6PEojv
The weekly chart highs $10,000 as a formidable support area. Consolidation is, however, expected in the near term according to the leveling Relative Strength Index. A broader scope to the upside highlights the zone between $12,000 and $14,000 as a critical resistance zone. However, if Bitcoin spikes through in the coming few weeks, then the goal to trade at $18,000 by October will be achievable.
BTC/USD weekly chart
 (37)-637351517853099146.png)
The monthly chart shows that Bitcoin does not have the technical muscle to hit $31,000 by the end of the year. However, fundamentals could prove otherwise, especially if the network continues to grow massively in the coming months. On hitting $20,000, the market could be hit by FOMO, bringing into the picture a parabolic rise like the one in 2017.
BTC/USD monthly chart
 (38)-637351512642964227.png)
Author

John Isige
FXStreet
John Isige is a seasoned cryptocurrency journalist and markets analyst committed to delivering high-quality, actionable insights tailored to traders, investors, and crypto enthusiasts. He enjoys deep dives into emerging Web3 tren


