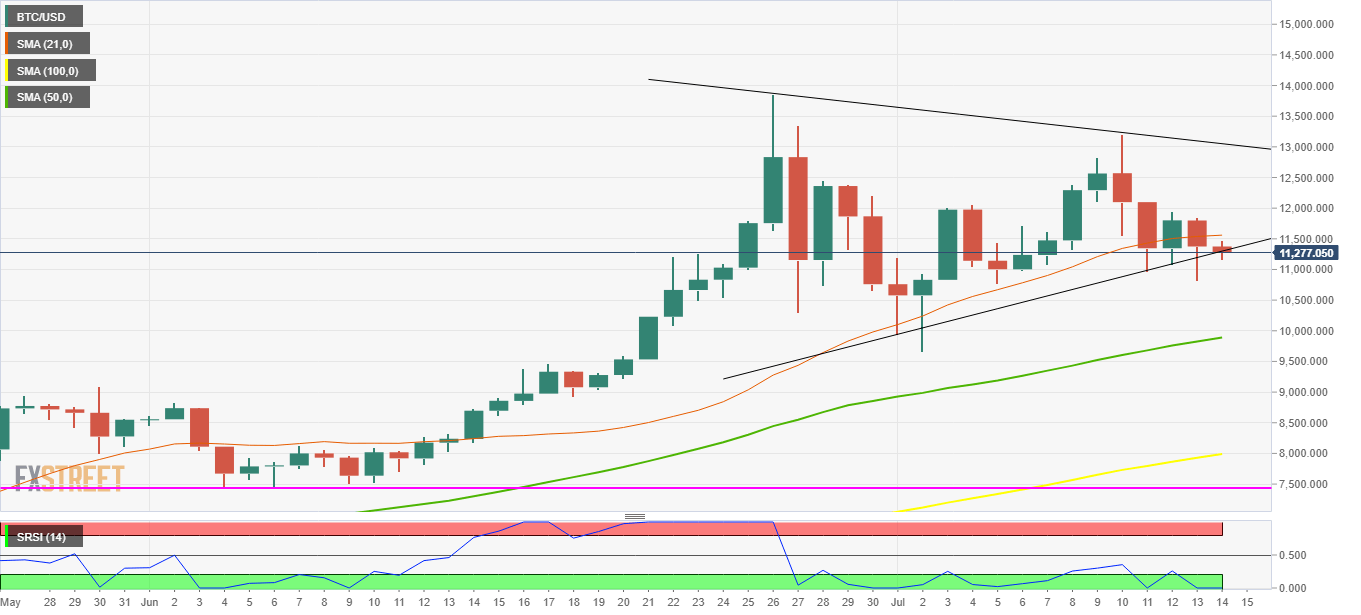
Bitcoin price analysis: Symmetrical triangle in play, focus on Sunday’s close


  • Symmetrical triangle spotted on the daily chart, the downside seems compelling.
  • A failure to close below 11,300, a test of 12k mark to be back on sight.

Bitcoin (BTC/USD), the most dominantly traded cryptocurrency, resumes its weekend tailspin, as the overnight recovery from eleven-day lows of 10,814 fizzled on early Sunday just shy of the 11,500 level. At the press time, the prices are seen flirting with the key support located at 11,300. The No. 1 coin is down nearly 3.50% over the last 24 hours but manages to maintain a market capitalization of about $ 201 billion, down from $ 207 billion seen on Saturday.

For the BTC price outlook over the next fortnight, Sunday’s close is pivotal, as the daily chart displays a symmetrical triangle formation. Over the last 2-weeks, the coin has traveled within the triangle, mostly along the slope of the trendline support while the upside attempts on two occasions faced rejection at the downward sloping trendline resistance.

Overall the bias looks towards the downside, but a triangle bearish break will be confirmed when the prices see a daily closing below the trendline support located at 11,300 levels. Therefore, all eyes remain on this Sunday’s close, as the prices are seen clinging to the above-mentioned key support so far. A daily close below the 11,300 level would open floors towards the upward sloping 50-day Simple moving average (DMA) now at 9,890, below which the 100-DMA at 7,990 will be on the sellers’ radar.

On the flip side, should the prices close above the 11,500/550 levels, the confluence of the immediate resistances and 21-DMA, the bulls would regain control and re-attempt the 12k barrier. A sustained break above the last, the descending trendline resistance of the triangle, placed just ahead of the 13,000 mark, will be back in play.

BTC/USD daily chart

Levels to Watch

BTC/USD

Overview
Today last price 11290
Today Daily Change -134.01
Today Daily Change % -1.18
Today daily open 11375.09
 
Trends
Daily SMA20 10653.49
Daily SMA50 9115.98
Daily SMA100 7221.55
Daily SMA200 5471.29
Levels
Previous Daily High 11844.43
Previous Daily Low 10813.72
Previous Weekly High 13195.19
Previous Weekly Low 10968.34
Previous Monthly High 13862.09
Previous Monthly Low 7437.33
Daily Fibonacci 38.2% 11207.45
Daily Fibonacci 61.8% 11450.7
Daily Pivot Point S1 10844.39
Daily Pivot Point S2 10313.7
Daily Pivot Point S3 9813.68
Daily Pivot Point R1 11875.11
Daily Pivot Point R2 12375.13
Daily Pivot Point R3 12905.82


Information on these pages contains forward-looking statements that involve risks and uncertainties. Markets and instruments profiled on this page are for informational purposes only and should not in any way come across as a recommendation to buy or sell in these assets. You should do your own thorough research before making any investment decisions. FXStreet does not in any way guarantee that this information is free from mistakes, errors, or material misstatements. It also does not guarantee that this information is of a timely nature. Investing in Open Markets involves a great deal of risk, including the loss of all or a portion of your investment, as well as emotional distress. All risks, losses and costs associated with investing, including total loss of principal, are your responsibility. The views and opinions expressed in this article are those of the authors and do not necessarily reflect the official policy or position of FXStreet nor its advertisers. The author will not be held responsible for information that is found at the end of links posted on this page.

If not otherwise explicitly mentioned in the body of the article, at the time of writing, the author has no position in any stock mentioned in this article and no business relationship with any company mentioned. The author has not received compensation for writing this article, other than from FXStreet.

FXStreet and the author do not provide personalized recommendations. The author makes no representations as to the accuracy, completeness, or suitability of this information. FXStreet and the author will not be liable for any errors, omissions or any losses, injuries or damages arising from this information and its display or use. Errors and omissions excepted.

The author and FXStreet are not registered investment advisors and nothing in this article is intended to be investment advice.

Recommended content


Recommended Content

Editors’ Picks

Crypto morning: Bitcoin's bullish surge, Fidelity's Ethereum leap, Trump-backed WLF's $3M MNT buy

Crypto morning: Bitcoin's bullish surge, Fidelity's Ethereum leap, Trump-backed WLF's $3M MNT buy

Bitcoin traders are reacting positively to the US Federal Reserve’s (Fed) policy shift. As BTC hovers around the $88,000 level on Monday, analysts are optimistic about Bitcoin price gains this week. Technical analysis supports Bitcoin’s bullish thesis. 

More Cryptocurrencies News
Dogecoin remains brand leader in meme coins – Fei Chen, Founder and CEO of Intellectia AI

Dogecoin remains brand leader in meme coins – Fei Chen, Founder and CEO of Intellectia AI

Dogecoin open interest plunged to a near four-month low in mid-March before beginning a slow recovery. Mr. Fei Chen, founder and CEO of Intellectia AI, shared his thoughts on Dogecoin, a potential DOGE ETF, and the likelihood of DOGE inclusion in a US Strategic Crypto Reserve in an interview. 

More Dogecoin News
Bitcoin could hit $110,000, supported by the Fed’s dovish stance and Trump’s flexibility on tariffs

Bitcoin could hit $110,000, supported by the Fed’s dovish stance and Trump’s flexibility on tariffs

Bitcoin price extends its gains and trade above $87,400 at the time of writing on Monday after recovering 4.25% last week. BitMEX co-founder Arthur Hayes predicts that BTC could hit $110,000 before retracing to $76,500, supported by the US Fed's dovish stance on inflation and US President Donald Trump’s flexibility on tariffs.

More Bitcoin News
Solana bull aims for $160 mark as White House narrows April 2 tariffs

Solana bull aims for $160 mark as White House narrows April 2 tariffs

Solana’s price extends its gains on Monday after recovering 5.32% last week. Reports suggest that the White House is narrowing its approach to tariffs set to take effect on April 2, likely omitting a set of industry-specific tariffs.

More Solana News
Bitcoin: BTC stabilizes around $84,000 despite US SEC regularity clarity and Fed rate stability

Bitcoin: BTC stabilizes around $84,000 despite US SEC regularity clarity and Fed rate stability

Bitcoin price stabilizes around $84,000 at the time of writing on Friday after recovering nearly 2% so far this week. The recent announcement by the US SEC that Proof-of-Work mining rewards are not securities could boost BTC investors' confidence. 

Read full analysis
The Best brokers to trade EUR/USD

The Best brokers to trade EUR/USD

SPONSORED Discover the top brokers for trading EUR/USD in 2025. Our list features brokers with competitive spreads, fast execution, and powerful platforms. Whether you're a beginner or an expert, find the right partner to navigate the dynamic Forex market.

Read More

BTC

ETH

XRP