Bitcoin price analysis: Symmetrical triangle in play below $ 12000 mark
- Short-term symmetrical triangle confines immediate moves.
- Sellers continue to lurk above the 12000 level.
- 50-hourly SMA near 11,880 offers strong support.

Bitcoin, the world’s most widely traded currency, consolidates the recovery from Saturday’s low of 11,335, as the heap of resistances placed between 12,000-12,500 levels continues to cap the upside attempts. Despite the range trade, the coin witnessed over 2% gains over the last 24 hours and maintains a market capitalization of around $ 213 billion.
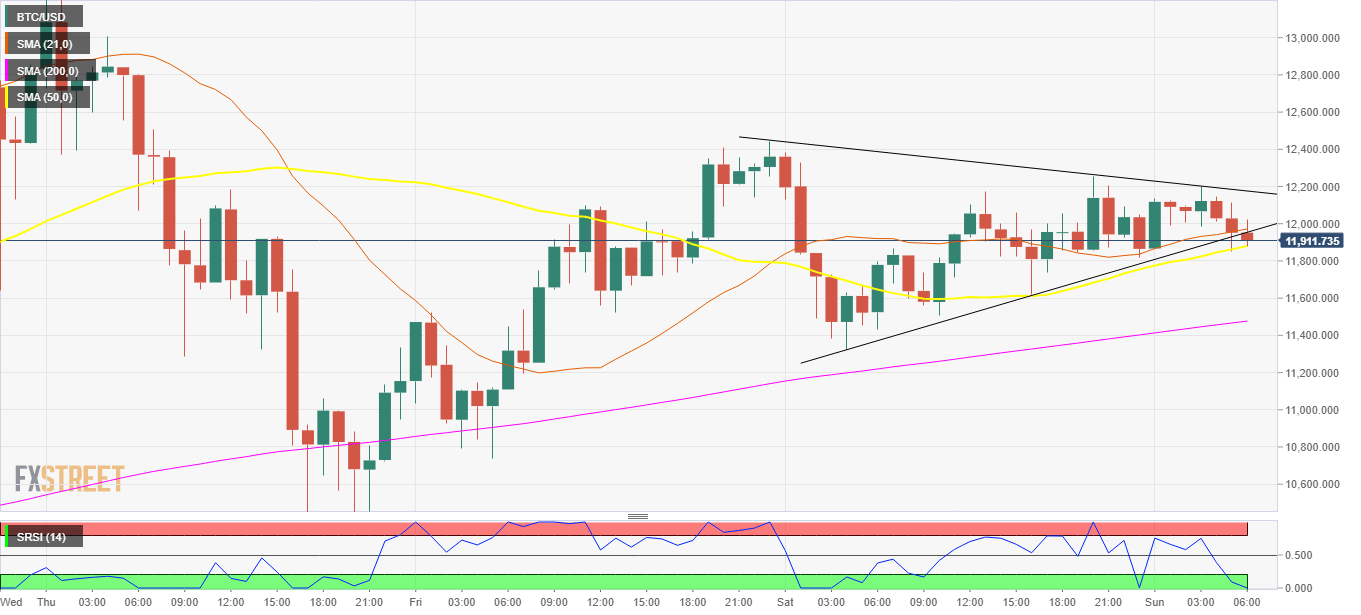
Markets seem to await fresh trading catalysts and therefore leave the prices confined in a symmetrical triangle formation, as observed on the 1-hour chart. A breakout is imminent as the range tapers further, with the downside bias more likely as the coin tests the solid support near 11,880 levels, the confluence of the 50-hourly Simple Moving Average (SMA) and the ascending trend line support. The sellers will take charge only below the last, opening floors for a test of the upward sloping 200-hourly SMA located at 11,450 levels. Saturday’s low will be on the bears’ radar should the prices fail to hold the 200-hourly SMA.
However, the hourly Relative Strength Index (RSI) is heavily oversold and looks set for a rebound, which could offer fresh signs of life to the BTC bulls. The rates could bounce in tandem with the RSI and regain the 12k mark above which the descending trendline resistance near 12,200 region could be tested in an attempt to regain Saturday’s high at 12,445.
BTC/USD 1-hour chart
Levels to Watch
Author

Dhwani Mehta
FXStreet
Residing in Mumbai (India), Dhwani is a Senior Analyst and Manager of the Asian session at FXStreet. She has over 10 years of experience in analyzing and covering the global financial markets, with specialization in Forex and commodities markets.


