Bitcoin Price Analysis: Buyers make sure that price stays above $9,000 following Thursday’s carnage
- BTC/USD dropped below the SMA 20 curve following Thursday’s price action.
- Both MACD and Elliott Oscillator show increasing bearish sentiment.

BTC/USD daily price chart
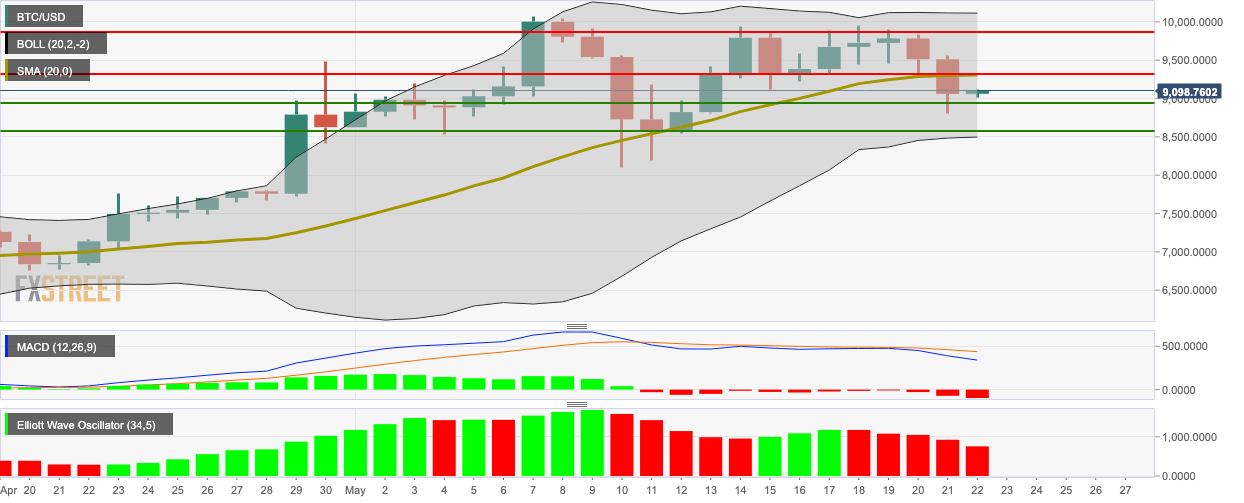
BTC/USD went up slightly from $9,060 to $9,091.25 in the early hour of Friday. This follows a hectic Thursday where Bitcoin crashed from $9,520 to $9,060, going below the SMA 20 curve, in the process. The MACD shows increasing bearish momentum, while the Elliott Oscillator has had five straight red sessions.
The bulls need to overcome resistance at $9,313.50, SMA 20 and 9,880.95 to reverse the ongoing bearish momentum. The bears should aim for support levels at $8,948.70 and $8,600 to continue the downward momentum.
Key levels
Author

Rajarshi Mitra
Independent Analyst
Rajarshi entered the blockchain space in 2016. He is a blockchain researcher who has worked for Blockgeeks and has done research work for several ICOs. He gets regularly invited to give talks on the blockchain technology and cryptocurrencies.


