• Bitcoin clings to recent recovery gains above the 7300 level.
  • The coin looks vulnerable amid not so favorable technical set up.
  • 200-HMA at 7,234 could cap losses if the sellers return.

The bulls appear exhausted in Saturday’s trading so far, as the recovery from two-week lows in Bitcoin (BTC/USD), the most favorite cryptocurrency, loses momentum on the 7,300 handle. At the time of writing, the spot trades near 7,345, gaining 1.30% over the last 24 hours while up nearly 0.50% on a weekly basis. Its market capitalization stands at $ 133.73 billion or 68.20% of the total market value.

Markets turn cautious and fail to buy into Friday’s recovery, as they see it as dead cat bounce amid bearish intraday technical set up while holiday-thinned volumes continue to persist.

Technical Overview

BTC/USD 1-hour chart


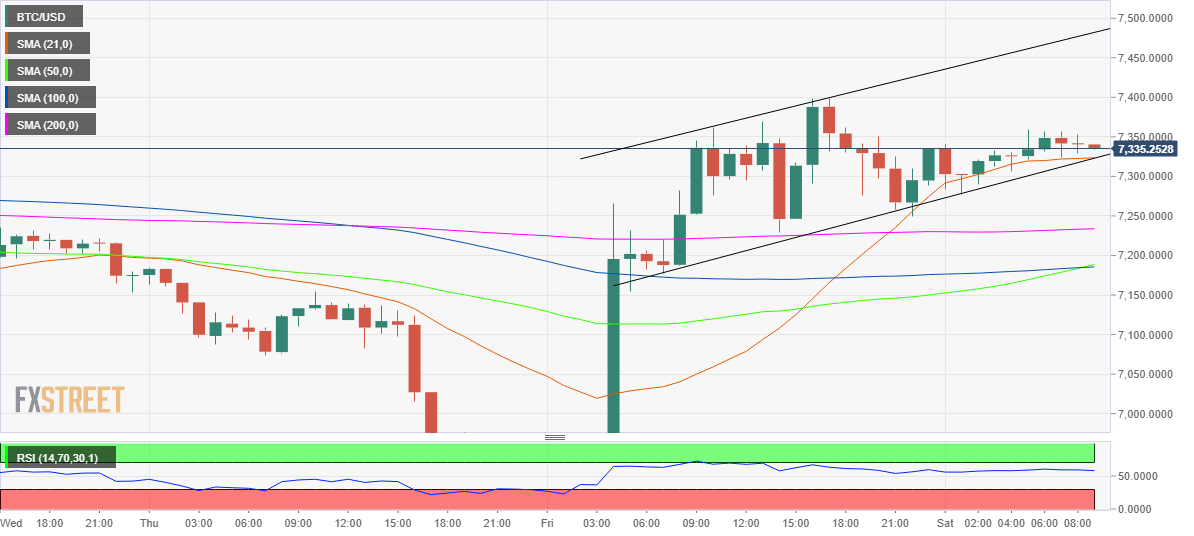
Having witnessed a solid comeback from near 6,855 levels on Friday, the BTC bulls are unable to extend the bullish momentum, leaving the coin listless in a tight range that portrays a rising channel formation. The natural tendency of the pattern is to the downside. Therefore, a break below the 7,323 level, the confluence of the 21- hourly Simple Moving Averages (HMA) and channel trendline support, will confirm a breakdown and bring back the 200-HMA horizontal support at 7,234 on the sellers’ radar.


The downslide will accelerate below the last, as the buyers seek the next strong support near the 7,185 region for their rescue. At the level, the horizontal 100-HMA and bullish 50-HMA coincide.

Alternatively, a bounce-back towards the 7,400 handle cannot be ruled out If the coin manages to defend the above-mentioned rising trendline (pattern) support. On a recovery above 7,400, the bulls could likely run into the next upside hurdle aligned at 7,482, the pattern resistance. For now, the hourly Relative Strength Index (RSI) trades flat but above the mid-line, suggesting that the sellers are likely to have a hard time fuelling a downside break. Therefore, Saturday’s daily closing remains pivotal to gauge the near-term direction in the No.1 coin.

BTC/USD key levels to watch

BTC/USD

Overview
Today last price 7345.60
Today Daily Change 16.39
Today Daily Change % 0.22
Today daily open 7335.5
 
Trends
Daily SMA20 7180.87
Daily SMA50 7394.61
Daily SMA100 7964.32
Daily SMA200 9255.46
 
Levels
Previous Daily High 7399.15
Previous Daily Low 6856.63
Previous Weekly High 7525.13
Previous Weekly Low 6856.63
Previous Monthly High 7770.78
Previous Monthly Low 6432.05
Daily Fibonacci 38.2% 7191.91
Daily Fibonacci 61.8% 7063.87
Daily Pivot Point S1 6995.03
Daily Pivot Point S2 6654.57
Daily Pivot Point S3 6452.52
Daily Pivot Point R1 7537.55
Daily Pivot Point R2 7739.61
Daily Pivot Point R3 8080.07


Information on these pages contains forward-looking statements that involve risks and uncertainties. Markets and instruments profiled on this page are for informational purposes only and should not in any way come across as a recommendation to buy or sell in these assets. You should do your own thorough research before making any investment decisions. FXStreet does not in any way guarantee that this information is free from mistakes, errors, or material misstatements. It also does not guarantee that this information is of a timely nature. Investing in Open Markets involves a great deal of risk, including the loss of all or a portion of your investment, as well as emotional distress. All risks, losses and costs associated with investing, including total loss of principal, are your responsibility. The views and opinions expressed in this article are those of the authors and do not necessarily reflect the official policy or position of FXStreet nor its advertisers. The author will not be held responsible for information that is found at the end of links posted on this page.

If not otherwise explicitly mentioned in the body of the article, at the time of writing, the author has no position in any stock mentioned in this article and no business relationship with any company mentioned. The author has not received compensation for writing this article, other than from FXStreet.

FXStreet and the author do not provide personalized recommendations. The author makes no representations as to the accuracy, completeness, or suitability of this information. FXStreet and the author will not be liable for any errors, omissions or any losses, injuries or damages arising from this information and its display or use. Errors and omissions excepted.

The author and FXStreet are not registered investment advisors and nothing in this article is intended to be investment advice.

Join Telegram

Recommended content


Recommended Content

Editors’ Picks

Ethereum dips slightly amid Renzo depeg, BlackRock spot ETH ETF amendment

Ethereum dips slightly amid Renzo depeg, BlackRock spot ETH ETF amendment

Ethereum (ETH) suffered a brief decline on Wednesday afternoon despite increased accumulation from whales. This follows Ethereum restaking protocol Renzo restaked ETH (ezETH) crashing from its 1:1 peg with ETH and increased activities surrounding spot Ethereum ETFs.

More Ethereum News

Injective price weakness persists despite over 5.9 million INJ tokens burned

Injective price weakness persists despite over 5.9 million INJ tokens burned

Injective (INJ) price is trading with a bearish bias, stuck in the lower section of the market range. The bearish outlook abounds despite the network's deflationary efforts to pump the price. Coupled with broader market gloom, INJ token’s doomed days may not be over yet.

More Injective News

US intensifies battle against crypto privacy protocols following crackdown on Samourai Wallet

US intensifies battle against crypto privacy protocols following crackdown on Samourai Wallet

CEO Keonne Rodriguez and CTO William Lonergan of Samourai Wallet were arrested by the US Department of Justice (DoJ) on Wednesday and charged with $100 million in money laundering on a count and illegal money transmitting on another count. This move could see privacy-focused cryptocurrencies take a dip.

More Cryptocurrencies News

Near Protocol Price Prediction: NEAR fulfills targets but a 10% correction may be on the horizon

Near Protocol Price Prediction: NEAR fulfills targets but a 10% correction may be on the horizon

Near Protocol price has completed a 55% mean reversal from the bottom of the market range at $4.27. Amid growing bearish activity, NEAR could drop 10% to the $6.00 psychological level before a potential recovery. A break and close above $7.95 would invalidate the downleg thesis.

More Near Protocol News

Bitcoin: BTC post-halving rally could be partially priced in Premium

Bitcoin: BTC post-halving rally could be partially priced in

Bitcoin (BTC) price briefly slipped below the $60,000 level for the last three days, attracting buyers in this area as the fourth BTC halving is due in a few hours. Is the halving priced in for Bitcoin? Or will the pioneer crypto note more gains in the coming days? 

Read full analysis

BTC

ETH

XRP