Bitcoin Price Analysis: BTC/USD runs out of steam as it nears the $9,500 level
- BTC/USD recovery begin to falter ahead of key resistance level.
- The Elliott Oscillator has had five straight red sessions.
- The 20-day Bollinger jaw has narrowed, which indicates decreasing price volatility.

BTC/USD daily chart
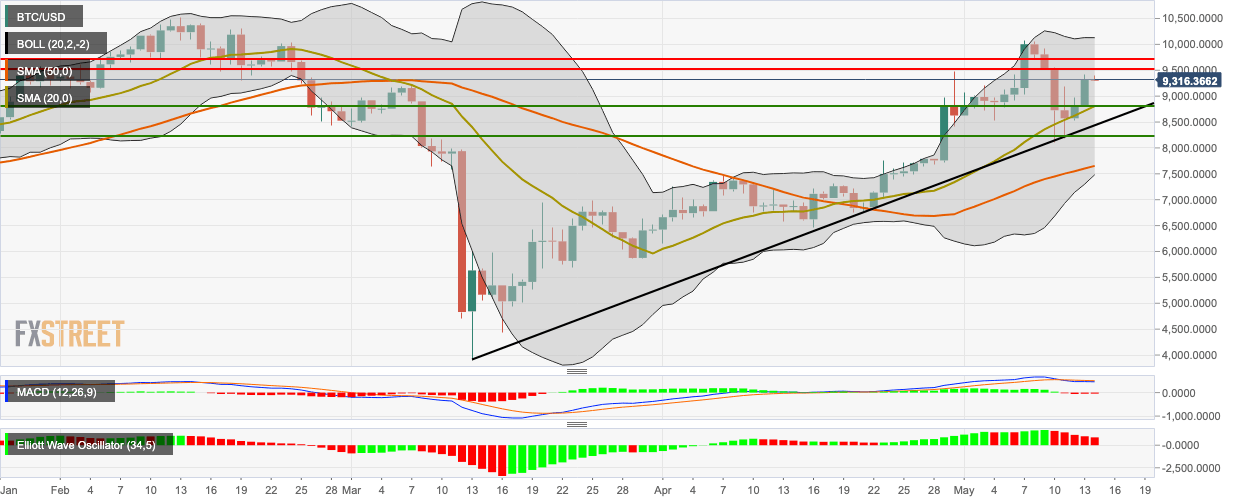
BTC/USD dropped a bit from $9,320 to $9,303 following a hugely bullish Wednesday. The Elliott Oscillator has had five straight red sessions, while the MACD shows sustained bearish momentum. The 20-day Bollinger jaw has narrowed, which indicates decreasing price volatility.
The price faces two resistance levels on the upside at $9,500 and $9,735. On the downside, there are two healthy support levels at $8,815.35 and $8,214.40.
Key levels
Author

Rajarshi Mitra
Independent Analyst
Rajarshi entered the blockchain space in 2016. He is a blockchain researcher who has worked for Blockgeeks and has done research work for several ICOs. He gets regularly invited to give talks on the blockchain technology and cryptocurrencies.
More from Rajarshi Mitra


