Bitcoin Price Analysis: BTC/USD refreshes levels under $6,000 as $5,000 beckons
- Bitcoin price explores the levels under $6,000 after failing to break above $7,000 resistance zone or hold above $6,200 support.
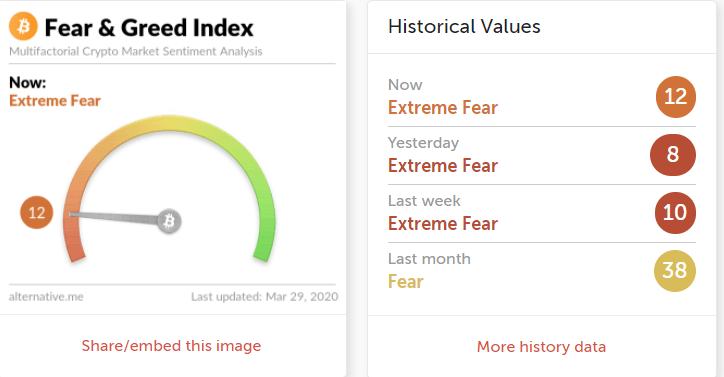
- Bitcoin fear grid index is in the extreme fear zone, suggesting that traders and investors remain bearish and anticipating more losses.

Bitcoin price continues to explore the levels towards $5,000 as discussed on Friday. The failure to break above the critical $7,000 level left the bulls discouraged but sellers gained confidence with the reducing trading volume. The fall in the price of Bitcoin is happening at the end of the month, moreover, investors could be anticipating another flash drop in the traditional markets at Monday’s opening.
Meanwhile, BTC/USD is trading at $5,994 following a breakdown beneath the key support at $6,200. The largest cryptocurrency by market capitalization needs to hold above the support at $5,800 (former support zone). However, if sellers push below this zone, Bitcoin price is likely to drop towards $5,700. If push comes to shove and declines extend, $5,350 is the next support target. After this zone, sellers will be eying $4400 and $3,864 respectively.
Bitcoin investors do not feel bullish at all in spite of the halving event being a month away. The fear grid index reads 12 (extreme fear zone), emphasizing that traders are bearish and envision the worst amid the status of the cryptocurrency market. On other the hand, there has been an improvement in sentiments around BTC in the past couple of weeks when the fear grid index fell to 8.
The 4-hour chart shows BTC/USD trading under an ascending trendline. The price is also dancing below the moving averages where the 50 SMA and the 100 SMA will hinder growth at $6,400 and $7,252. The RSI has tested the zone at 30 and is pointing upwards to show that buying pressure is improving gradually (short term analysis). However, the MACD continues to emphasize that the bears are strongly in control.
BTC/USD 4-hour chart
-637211331058715621.png)
Author

John Isige
FXStreet
John Isige is a seasoned cryptocurrency journalist and markets analyst committed to delivering high-quality, actionable insights tailored to traders, investors, and crypto enthusiasts. He enjoys deep dives into emerging Web3 tren


