Bitcoin Price Analysis: BTC/USD holding above ascending channel support as $9,000 beckons a day to 2020 halving
- Bitcoin price recovers from weekend lows at $8,100 but momentum loses steam under $8,900.
- The ascending channel support was very instrumental to the recovery.
- BTC/USD technical picture hints towards consolidation before a breakout amid the halving.

The cryptocurrency market has stabilized following a gruesome weekend session, especially on Sunday. Bitcoin dropped like a stone in the air from levels close to $10,000 to the extent that it tested $8,100. The devastating fall rubbed off on other cryptos such as Ethereum and Rippled which spiraled to $180 and $0.1750 respectively.
Bitcoin bulls quickly took charge of the price following the breakdown and forced a considerable reversal towards $9,000. However, the upward momentum has fizzled out at under $8,900 with the intraday high on Monday forming at $8,812. The existing trend is bullish but the volume remains low. This suggests that buyers could remain in the driver seat but rapid price actions are unlikely to take place.
Bitcoin technical analysis
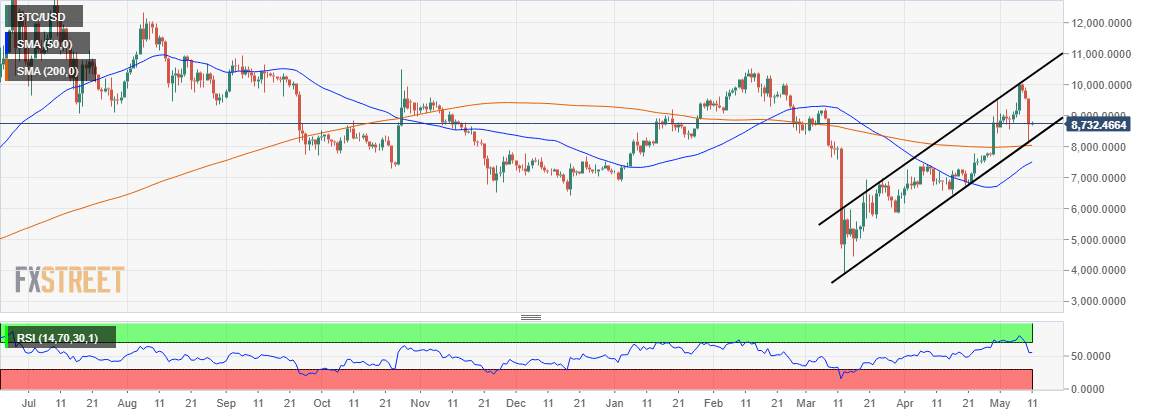
Looking at the daily chart, Bitcoin displayed a strongly bullish picture despite the drop. Ascending channel support stayed in place after being stress-tested by the fall. The 200-day SMA also stood firm at $8,000 preventing further breakdown.
The sideways action above $8,700 is reminiscent of the RSI’s horizontal motion at 54. It is commendable that the indicator stayed above average. As long as the leveling continues, a consolidation is likely to take place ahead of the halving on Tuesday.
Following the halving, Bitcoin is expected to rally exponentially. The event is expected to send Bitcoin to new all-time highs. It is the predictions that encourage speculation as investors join the market to capitalize on the expected bull-run. In the meantime, growth above $9,000 would be a welcoming and encouraging picture for investors before the halving takes place.
BTC/USD daily chart
Author

John Isige
FXStreet
John Isige is a seasoned cryptocurrency journalist and markets analyst committed to delivering high-quality, actionable insights tailored to traders, investors, and crypto enthusiasts. He enjoys deep dives into emerging Web3 tren



