Bitcoin Price Analysis: BTC/USD consolidates weekly losses near $11,500
- Bitcoin extends its correction after jumping to fresh 13-month highs.
- BTC/USD is down more than 3% on a weekly basis.
- $11,200 aligns as the next support on the downside.

After climbing to its highest level since July 2019 at $12,480 at the start of the week, Bitcoin (BTC/USD) reversed its direction and dropped below $12,000 on Wednesday. Although the pair staged a modest rebound on Thursday, it failed to reclaim $12,000 and fell sharply on Friday, losing 2.8% to $11,530.
During the Asian trading hours on Saturday, Bitcoin extended its slide and touched its lowest level since August 13th at $11,370 but erased its losses in the last hour to turn flat above $11,500.
Bitcoin technical outlook
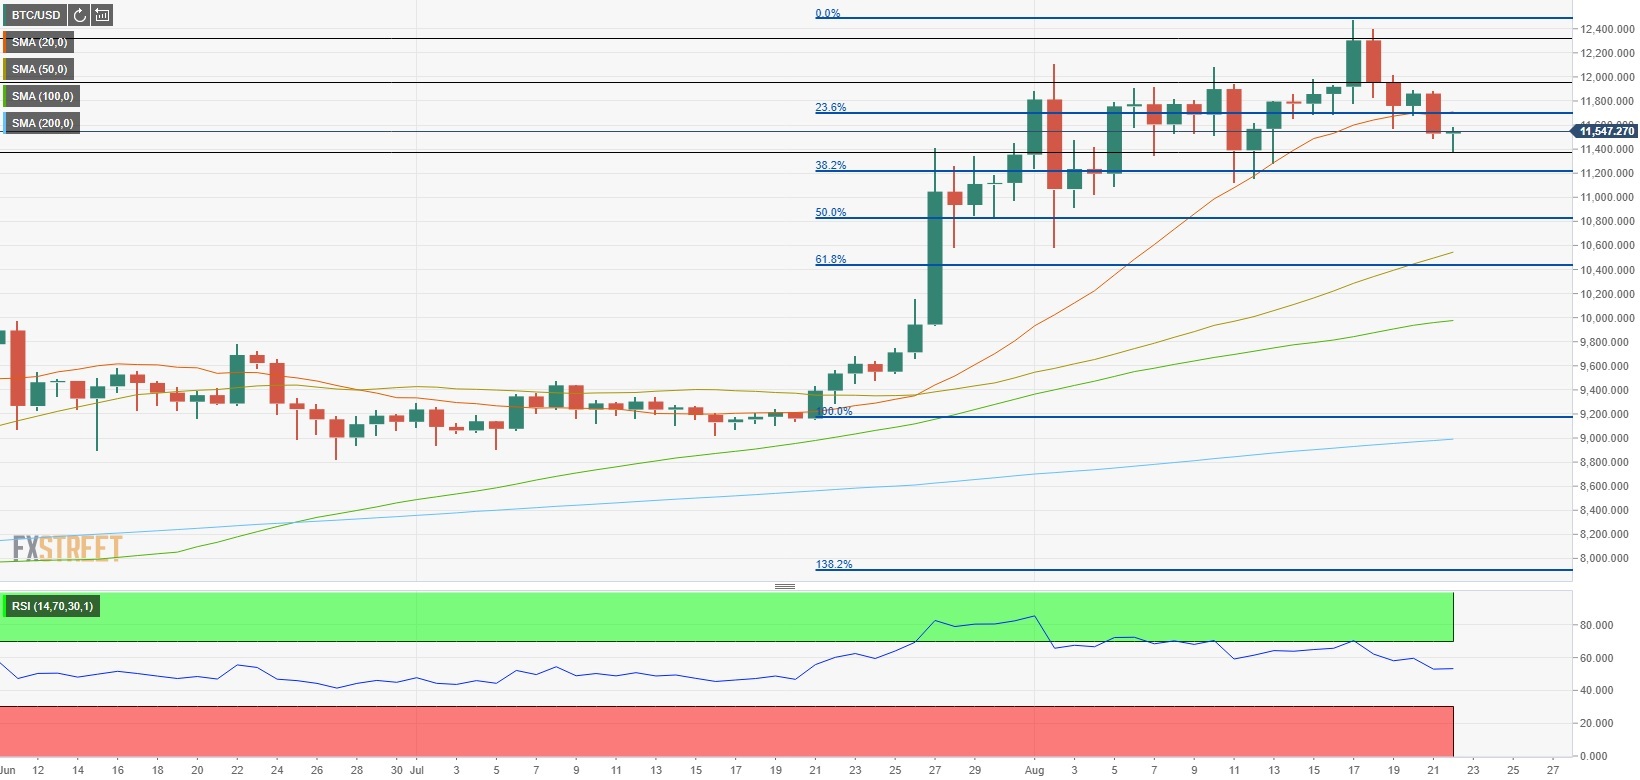
On Friday, BTC/USD close below the 20-day SMA for the first time since July 21st. Additionally, the RSI indicator on the daily chart is at its lowest level since that same date, suggesting that sellers are looking to take control of the price action. On the downside, $11,370 (daily low) could be seen as interim support ahead of $11,200 (Fibonacci 38.2% retracement of late-July to mid-August uptrend).
Resistances, on the other hand, are located at $11,700 (20-day SMA/Fibonacci 23.6% retracement) and $12,000 (psychological level).
BTC/USD chart (daily)
Author

Eren Sengezer
FXStreet
As an economist at heart, Eren Sengezer specializes in the assessment of the short-term and long-term impacts of macroeconomic data, central bank policies and political developments on financial assets.


