• Bitcoin catches fresh bids on Saturday after a down Friday.
  • Technical set up favors BTC bulls, eyes set on $12K mark.
  • The coin has pierced above all the major HMAs.

Bitcoin (BTC/USD) has finally broken the recent consolidative phase to the upside, as the bulls cleared the $11,700 resistance. The recovery momentum from Friday’s slide to $11, 348 gained traction, with the price gaining over 1% on a daily basis, at the press time. The market capitalization of the most favorite digital asset stands at $213.99 billion.

Technical Overview

BTC/USD: Hourly chart

fxsoriginalThe No.1 coin saw a quick $200 spike to $11,766 highs after a falling channel breakout was spotted on the hourly chart in the last hour.

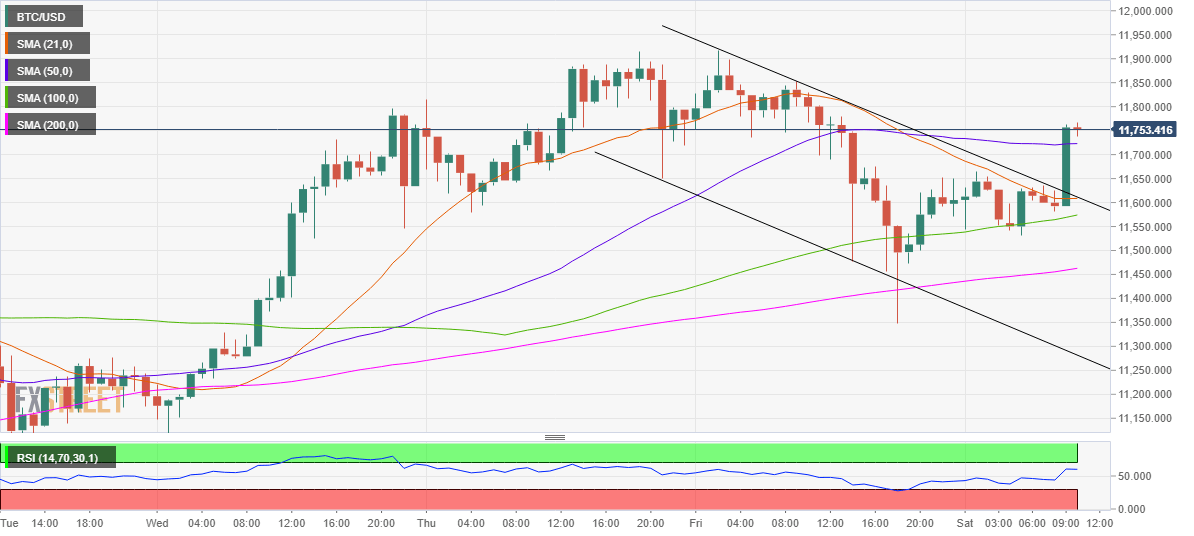
With the bullish break, the BTC bulls stormed through the 21-hourly Simple Moving Average (HMA) at 11,608 and subsequently, pierced above the horizontal 50-HMA at 11,722.

The bulls now gear up for a test of Friday’s high at 11,918 above which the $12K level could be put to test.

Acceptance above the latter could likely open doors towards the yearly highs of $12,112.

The hourly Relative Strength Index (RSI) has turned flat but holds firmly above the midline and below the overbought region, implying that there is more room for the upside.  

On the flip side, the critical resistance-turned-support at $11,610, the convergence of the pattern resistance and 21-HMA, will limit the corrective declines.

The sellers will then aim for the upward-sloping 100-HMA at $11,573, below which the bullish 200-HMA at $11,462 will be a tough nut to crack for the BTC bears.

BTC/USD: Additional levels to watch

BTC/USD

Overview
Today last price 11758.780
Today Daily Change 137.07
Today Daily Change % 1.18
Today daily open 11605.2
 
Trends
Daily SMA20 10607
Daily SMA50 9787.51
Daily SMA100 9580.08
Daily SMA200 8780.96
 
Levels
Previous Daily High 11918.24
Previous Daily Low 11348.65
Previous Weekly High 12112.72
Previous Weekly Low 10583.38
Previous Monthly High 11457.43
Previous Monthly Low 8907.52
Daily Fibonacci 38.2% 11566.24
Daily Fibonacci 61.8% 11700.66
Daily Pivot Point S1 11329.82
Daily Pivot Point S2 11054.44
Daily Pivot Point S3 10760.23
Daily Pivot Point R1 11899.41
Daily Pivot Point R2 12193.62
Daily Pivot Point R3 12469


Information on these pages contains forward-looking statements that involve risks and uncertainties. Markets and instruments profiled on this page are for informational purposes only and should not in any way come across as a recommendation to buy or sell in these assets. You should do your own thorough research before making any investment decisions. FXStreet does not in any way guarantee that this information is free from mistakes, errors, or material misstatements. It also does not guarantee that this information is of a timely nature. Investing in Open Markets involves a great deal of risk, including the loss of all or a portion of your investment, as well as emotional distress. All risks, losses and costs associated with investing, including total loss of principal, are your responsibility. The views and opinions expressed in this article are those of the authors and do not necessarily reflect the official policy or position of FXStreet nor its advertisers. The author will not be held responsible for information that is found at the end of links posted on this page.

If not otherwise explicitly mentioned in the body of the article, at the time of writing, the author has no position in any stock mentioned in this article and no business relationship with any company mentioned. The author has not received compensation for writing this article, other than from FXStreet.

FXStreet and the author do not provide personalized recommendations. The author makes no representations as to the accuracy, completeness, or suitability of this information. FXStreet and the author will not be liable for any errors, omissions or any losses, injuries or damages arising from this information and its display or use. Errors and omissions excepted.

The author and FXStreet are not registered investment advisors and nothing in this article is intended to be investment advice.

Join Telegram

Recommended content


Recommended Content

Editors’ Picks

Dogwifhat price pumps 5% ahead of possible Coinbase effect

Dogwifhat price pumps 5% ahead of possible Coinbase effect

Dogwifhat (WIF) price recorded an uptick on Thursday, going as far as to outperform its peers in the meme coins space. Second only to Bonk Inu (BONK), WIF token’s show of strength was not just influenced by Bitcoin (BTC) price reclaiming above $63,000.

More Dogwifhat News

Runes likely to have massive support after BRC-20 and Ordinals frenzy

Runes likely to have massive support after BRC-20 and Ordinals frenzy

PUPS, WZRD, and PEPE are gaining liquidity through Bitcoin Ordinals. Creator of Bitcoin’s Ordinals protocol is debuting a new fungible token standard to rival BRC-20, Runes.

More Cryptocurrencies News

Ethereum shows firm support at key level as its correlation with US indices increase

Ethereum shows firm support at key level as its correlation with US indices increase

Ethereum's price continued a sideways movement on Thursday as the market still awaits a trigger. Ethereum isn't alone in this horizontal trend; several major index funds have also traded sideways.

More Ethereum News

Mango Market attacker convicted of fraud and market manipulation

Mango Market attacker convicted of fraud and market manipulation

Mango Market attacker Avi Eisenberg was convicted by a federal jury on Thursday for "fraudulently obtaining" funds from the Solana-based decentralized exchange (DEX). He could face up to 20 years in prison for his role in the $110 million attack.

More Cryptocurrencies News

Bitcoin: BTC’s rangebound movement leaves traders confused

Bitcoin: BTC’s rangebound movement leaves traders confused

Bitcoin (BTC) price has been hovering around the $70,000 psychological level for a few weeks, resulting in a rangebound movement. This development could lead to a massive liquidation on either side before a directional move is established. 

Read full analysis

BTC

ETH

XRP