Bitcoin Price Analysis: BTC bears tighten the grip, bulls ready to strike back
- Bitcoin will continue moving in a tight range.
- The Golden Cross on the short-term picture sends bullish signals.
- The price may extend the correction to $10,000 before the growth is resumed.

Bitcoin attempted a recovery above $10,500 on Sunday, September 13, but failed to hold the ground. At the time of writing. The pioneer digital currency is changing hands at $10,350, mostly unchanged since the start of the day. Moreover, the coin has been oscillating in a tight range for over a week now amid the high indecision level on the market. While Bitcoin HODLers sit tight and wait for the prices to resume the upside momentum, speculative traders might feel frustrated and start looking for clues to understand what's going on and when moon again.
Let's have a closer look at the technical picture to see if the breakthrough is coming.
BTC/USD daily chart
-637356659802674442.png)
On a daily chart, BTC/USD rebounded from the upper boundary of the recent consolidation range at $10,500. The chances are that the price will retest the channel support before the bulls launch another recovery attempt. Bitcoin dived below $10,000 on numerous occasions during the previous wee; however, each time, a thick layer of buy orders located around that area pushed it back.
Meanwhile, BTC positioning data shows that nearly 1.4 million addresses with over 750,000 coins have their breakeven point on the approach to $10,000. This barrier is followed by another pack of 700k addresses with the breakeven in the range from $10,000 to $9,700. Most likely, bears will have a hard time making their way through these thick protective layers of protective. However, if they succeed, the sell-off may gain traction with the next focus on $9,200-$9,000, which coincides with the longer-term correction target, as explained in detail in our weekly forecast. The daily SMA200 and weekly SMA50 add credibility to this support area.
Bitcoin's In/Out of the Money data
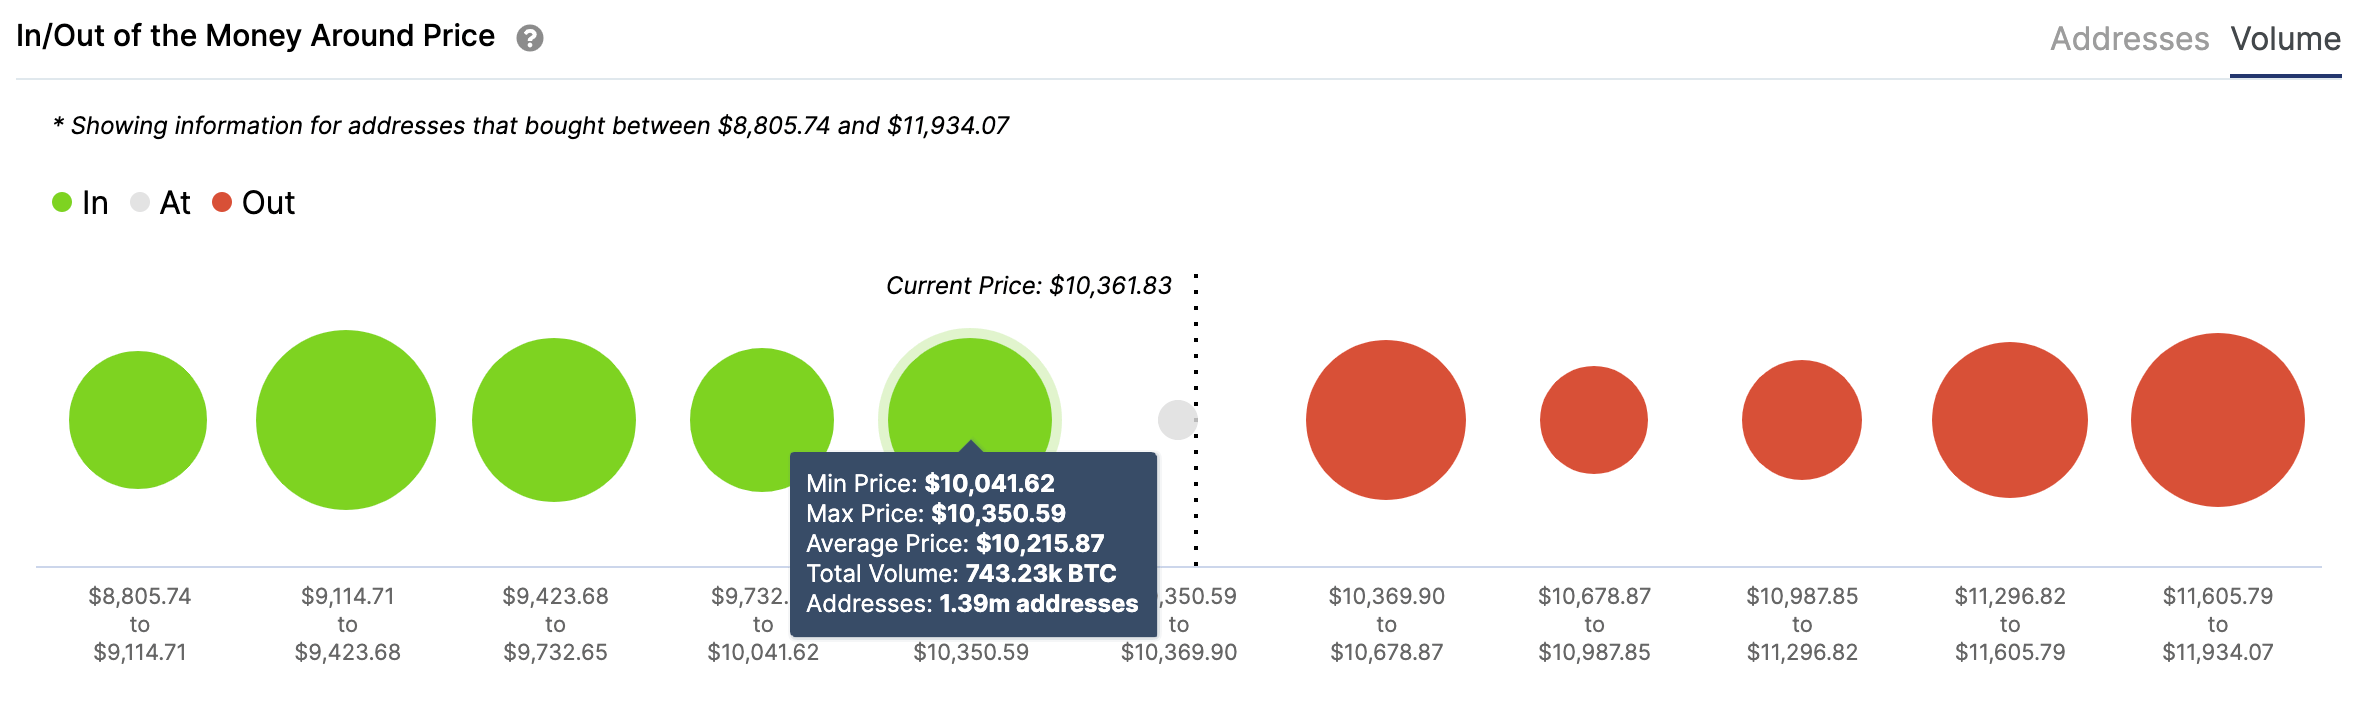
Source: Intotheblock
If we zoom in to the 4-hour timeframe, the price is supported by SMA50 at $10,270. This local barrier separates BTC from a decline to the lower line of the sideways channel. The series of Dojis and candles with small bodies confirm the market's indecisiveness, which means we may stay in the current range a little bit longer. Also, the market positioning implies that a wall of supply in the area of $10,400-$10,600 may slow down the recovery. However, once it is out of the way, the upside momentum is likely to gain traction with the next focus on the psychological barrier of $11,000, followed by the 4-hour SMA200 at $11,200.
BTC/USD 4-hour chart
-637356660195028000.png)
On the 1-hour chart, the short-term price movements are limited by SMA50 on approach to $10,400 and SMA200 at $10,250, which confirms the range-bound state of the market. However, the Golden Cross that has transpired on this time frame is a distinct bullish signal. The Golden Cross is a situation when a short-term SMA crosses the long-term SMA from the downside.
BTC/USD 1-hour chart
-637356660546436818.png)
To conclude: BTC/USD is locked in a tight range and may continue moving sideways for the time being as there are substantial technical and fundamental barriers both on above and below the current price. The short-term indicators imply that BTC/USD may be ready for an extended recovery; however, this signal should be confirmed by a sustainable move above $10,500-$10,600. Once this happens, $11,000 will come into focus. On the other hand, a failure to clear the upside barrier will push the price towards the lower boundary of the range of $10,000, which is strong enough to slow down the decline and create another bullish impulse. Otherwise, the sell-off will continue towards the long-term correction target at $9,000.
Author

Tanya Abrosimova
Independent Analyst


