|

Bitcoin Price Analysis: $9200 is the level to beat for the BTC bulls in the near-term

  • Bitcoin consolidates Saturday’s brief spike to $9200.
  • The No.1 coin looks to retest $9200 on the hourly chart.
  • The downside appears more compelling on the daily sticks.

Bitcoin (BTC/USD) has entered a phase of consolidation after reversing sharply from the late-Saturday spike to $9195.19 highs. The spot was sold-off at the $9200 level amid thin liquidity on the US Independence Day. The choppy trend is likely to extend across the crypto space as traders are away due to the extended weekend break. Markets are awaiting a strong catalyst to revive the near-term bullish momentum on Sunday. Meanwhile, the No. 1 coin is poised to end the week with modest gains, currently defending the $9100 mark. It enjoys a market capitalization of $167.69 billion.

Technical Overview

BTC/USD: Hourly chart

fxsoriginal

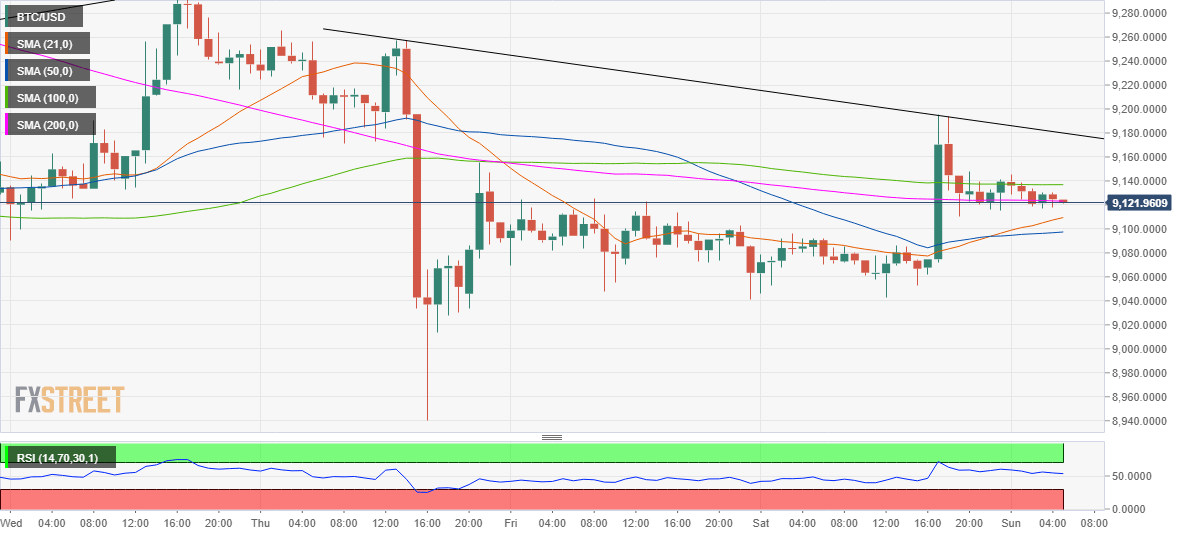
On the hourly chart, the price is back below the horizontal 100-hourly Simple Moving Average (HMA) at $9136.88 while clinging to 200-HMA at $9123.13 so far this Sunday. The hourly Relative Strength Index (RSI) trades neutral but above the midline, suggesting there is still scope for a fresh leg higher.

Meanwhile, the 21-HMA at $9109 had crossed the 50-HMA from below in the overnight trades, which also backs the case for another test of the $9200 mark should the 100-HMA barrier give way once again.

Until a fresh volatility wave hits the crypto space once again, the No. 1 coin is likely to range between the 100-HMA and 21-HMA in the day ahead.

BTC/USD: Daily chart

fxsoriginal

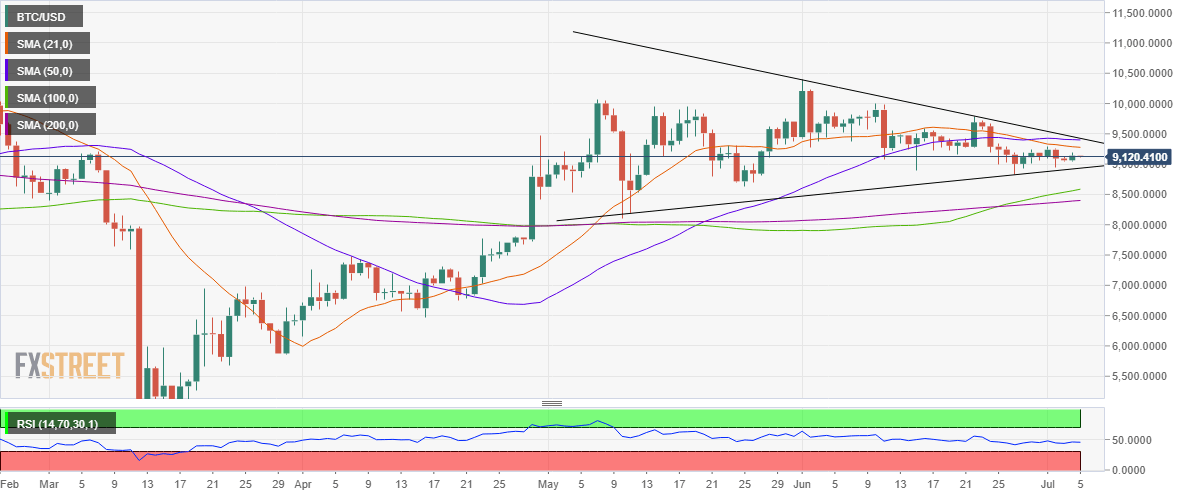
The price is trending in a potential symmetrical triangle pattern on the daily sticks since early May, forming lower highs over the past one month while the daily RSI continues to trade below the 50 level.

Further, the 21-daily Simple Moving Average (21-DMA) cut the 50-DMA from above last week, as the coin trades below the aforesaid DMAs.

Inferring from the above technical indicators, the path of least resistance appears to the downside in the coming weeks, given a lack of healthy support levels.

A breach of the rising trendline support at $8919.80 will confirm the pattern breakdown, opening floors for a test of the upward sloping 100-DMA at $8559. The next support awaits at the horizontal 200-DMA at $8390.97.

On the flip side, if the bulls succeed to take out the 21-DMA, the $9405/50 area will be a tough nut to crack. That supply zone is the confluence of the 100-DMA and the falling trendline resistance.   

BTC/USD: Additional levels to watch

BTC/USD

Overview
Today last price9122.35
Today Daily Change-16.21
Today Daily Change %-0.18
Today daily open9139.44
 
Trends
Daily SMA209285.1
Daily SMA509404.55
Daily SMA1008559.4
Daily SMA2008390.97
 
Levels
Previous Daily High9195.2
Previous Daily Low9043.05
Previous Weekly High9298.41
Previous Weekly Low8933.95
Previous Monthly High10404.88
Previous Monthly Low8823.34
Daily Fibonacci 38.2%9137.08
Daily Fibonacci 61.8%9101.17
Daily Pivot Point S19056.6
Daily Pivot Point S28973.75
Daily Pivot Point S38904.45
Daily Pivot Point R19208.74
Daily Pivot Point R29278.04
Daily Pivot Point R39360.89

Author

Dhwani Mehta

Dhwani Mehta

FXStreet

Residing in Mumbai (India), Dhwani is a Senior Analyst and Manager of the Asian session at FXStreet. She has over 10 years of experience in analyzing and covering the global financial markets, with specialization in Forex and commodities markets.

More from Dhwani Mehta
Share:

Markets move fast. We move first.

Orange Juice Newsletter brings you expert driven insights - not headlines. Every day on your inbox.

By subscribing you agree to our Terms and conditions.

Editor's Picks

BNB Price Forecast: BNB slips below $855 as bearish on-chain signals and momentum indicators turn negative

BNB, formerly known as Binance Coin, continues to trade down around $855 at the time of writing on Tuesday, after a slight decline the previous day. Bearish sentiment further strengthens as BNB’s on-chain and derivatives data show rising retail activity.

Top Crypto Losers: Aster, Midnight, and Ethena extend losses as selling pressure mounts

Aster, Midnight, and Ethena are the altcoins with the most losses over the last 24 hours, as the broader cryptocurrency market weakens amid Bitcoin dropping below $86,000. ASTER, NIGHT, and ENA risk further losses as selling pressure mounts and risk-off sentiment spreads across the crypto market.

Ethereum Price Forecast: BitMine acquires 102,259 ETH as price plunges 5%

Ethereum (ETH) treasury company BitMine Immersion scaled up its digital asset stash last week after acquiring 102,259 ETH since its last update. The purchase has increased the company's holdings to 3.96 million ETH, worth about $11.82 billion at the time of publication.

Strategy scoops about $1 billion in Bitcoin for second consecutive week

Bitcoin (BTC) treasury and financial intelligence firm Strategy expanded its holdings following another round of weekly accumulation.

Orange Juice Newsletter – Smart insights by real people. Every day.

A free newsletter highlighting key market trends to help traders stay a step ahead. Daily insights on the most relevant trading topics, compiled by our experts in an easy-to-read format so you never miss an important move.

Bitcoin: Fed delivers, yet fails to impress BTC traders

Bitcoin (BTC) continues de trade within the recent consolidation phase, hovering around $92,000 at the time of writing on Friday, as investors digest the Federal Reserve’s (Fed) cautious December rate cut and its implications for risk assets.