Bitcoin metric prints 'mother of all BTC bullish signals' for 4th time ever

A Bitcoin (BTC $23,880) price indicator has flashed green for just the fourth time ever this week in a major warning to bears.
In a tweet on Feb. 16, crypto market analyst Mohit Sorout announced that the Dollar Cost Average (DCA) Indicator was now “suggesting a raging bull market.”
DCA breakout last preceded 640% BTC price upside
The latest Bitcoin metric to flip bullish on long timeframes, DCA is even getting attention from major Bitcoin investment circles.
Its buy signals are rare, with Sorout seeing just three throughout Bitcoin’s history — but all of that precluded serious BTC price upside.
“Today marks the 4th time this signal is suggesting a raging bullmarket,” he wrote in comments, describing the event as “the mother of all btc bullish signals.”
DCA refers to an investment strategy whereby a buyer allocates a set amount of capital to gain exposure to an asset at set intervals. This could be buying $10 per week in Bitcoin, for example, and the concept is regularly touted as an optimal way of gaining exposure to volatile cryptocurrencies.
The DCA Indicator measures the relative profitability of a hypothetical DCA strategy involving $1 buys per day for a year.
Once it crosses into profitable territory, marked as 365 on its scale, major bull markets begin, Sorout argues. An exception appears to be mid-2022, when a move above the 365 mark subsequently reversed and BTC/USD began its journey to multi-year lows near $15,600.
Nonetheless, amid an atmosphere of increasing faith in Bitcoin’s 2023 recovery enduring, others were also willing to give the latest breakout the benefit of the doubt.
“Rare massive Bitcoin Buy signal,” Dan Tapiero, founder and CEO of 10T Holdings, declared in a repost of Sorout’s findings.
Bitcoin price death crosses and a "failed breakout"
Beyond DCA, another rare bull signal this month comes in the form of the Williams %R Oscillator, Cointelegraph reported.
Depending on the timeframe, however, its Bitcoin bull run signals do not yet point unequivocally to the moon.
Caleb Franzen, senior market analyst at Cubic Analytics who flagged the breakout, is meanwhile warning that Bitcoin’s latest trip to six-month highs represents a “failed breakout.”
The largest cryptocurrency also faces a major hurdle in the form of several moving averages (MAs) overhead, these acting as resistance for much of 2022.
Data from Cointelegraph Markets Pro and TradingView further showed two MAs in particular forming a "death cross" for the first time ever this month.
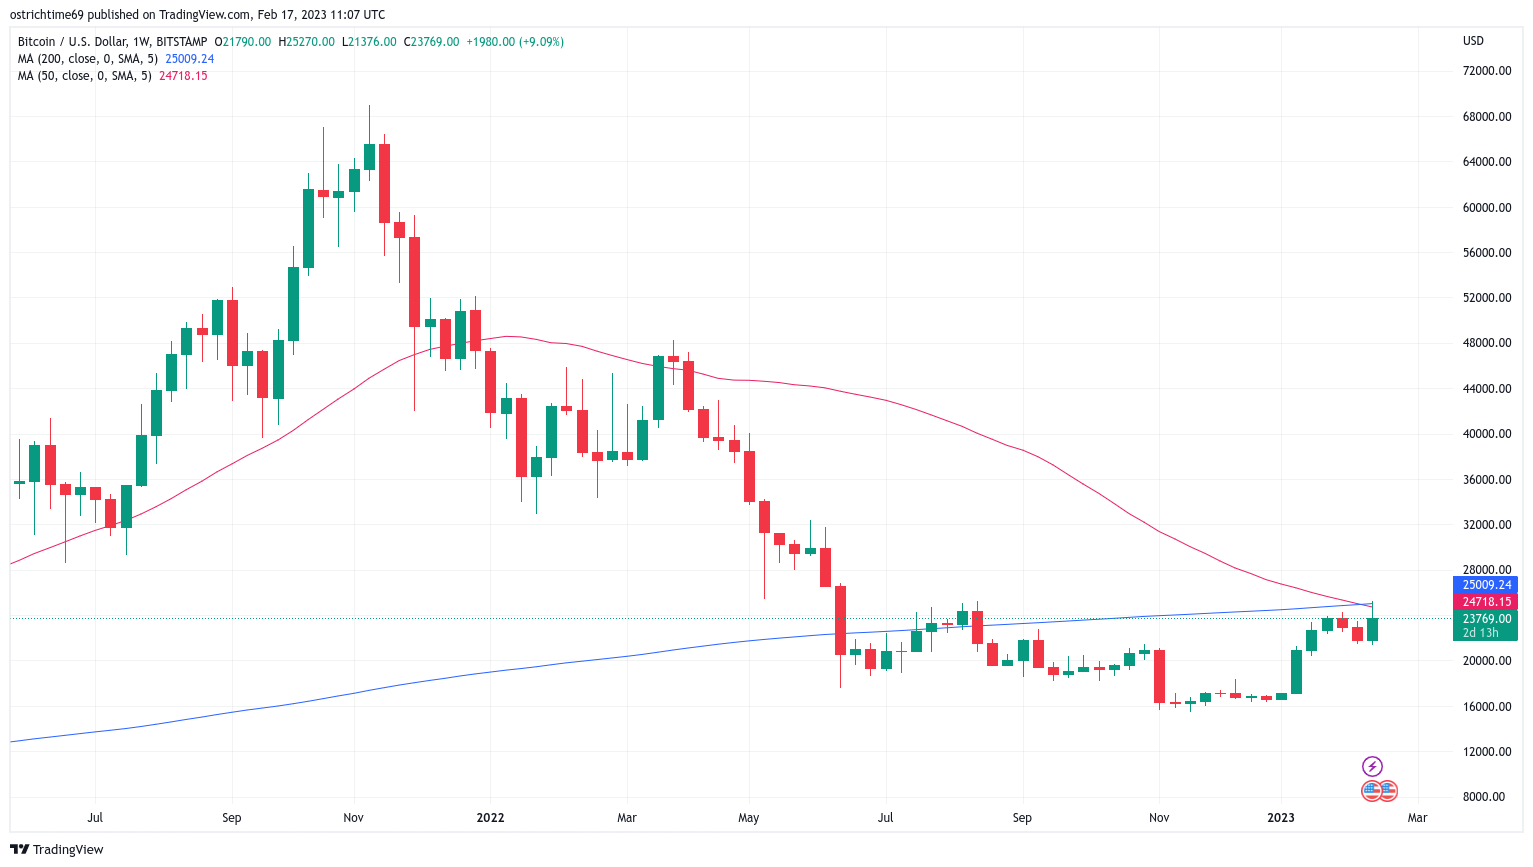
BTC/USD 1-week candle chart (Bitstamp) with 50, 200MA. Source: TradingView
Author

Cointelegraph Team
Cointelegraph
We are privileged enough to work with the best and brightest in Bitcoin.


