Bitcoin: Max pain zone tapped – Bear trap or breakdown?

Bitcoin has just revisited the $110K zone, tapping into the max pain area for longs. This comes only weeks after the massive liquidation cascade sparked by Trump’s tariff announcement, which wiped out more than $4.2 billion in leveraged positions — the largest crypto washout of the year.
Now, after briefly reclaiming $112K, Bitcoin is teasing lower once again. The market sits at a crossroads: has the worst already been priced in, or is this setting up as a classic bear trap before a sharp reversal?
Despite Jerome Powell’s dovish tone, Bitcoin continues to underperform traditional markets. The Nasdaq 100 (CFD: USTEC) has rallied more than 3% from recent lows, while BTC struggles to hold above $110K. That weakness hints at lingering caution across crypto, even as equities regain their footing.
Bitcoin 1D, 50-EMA band analysis
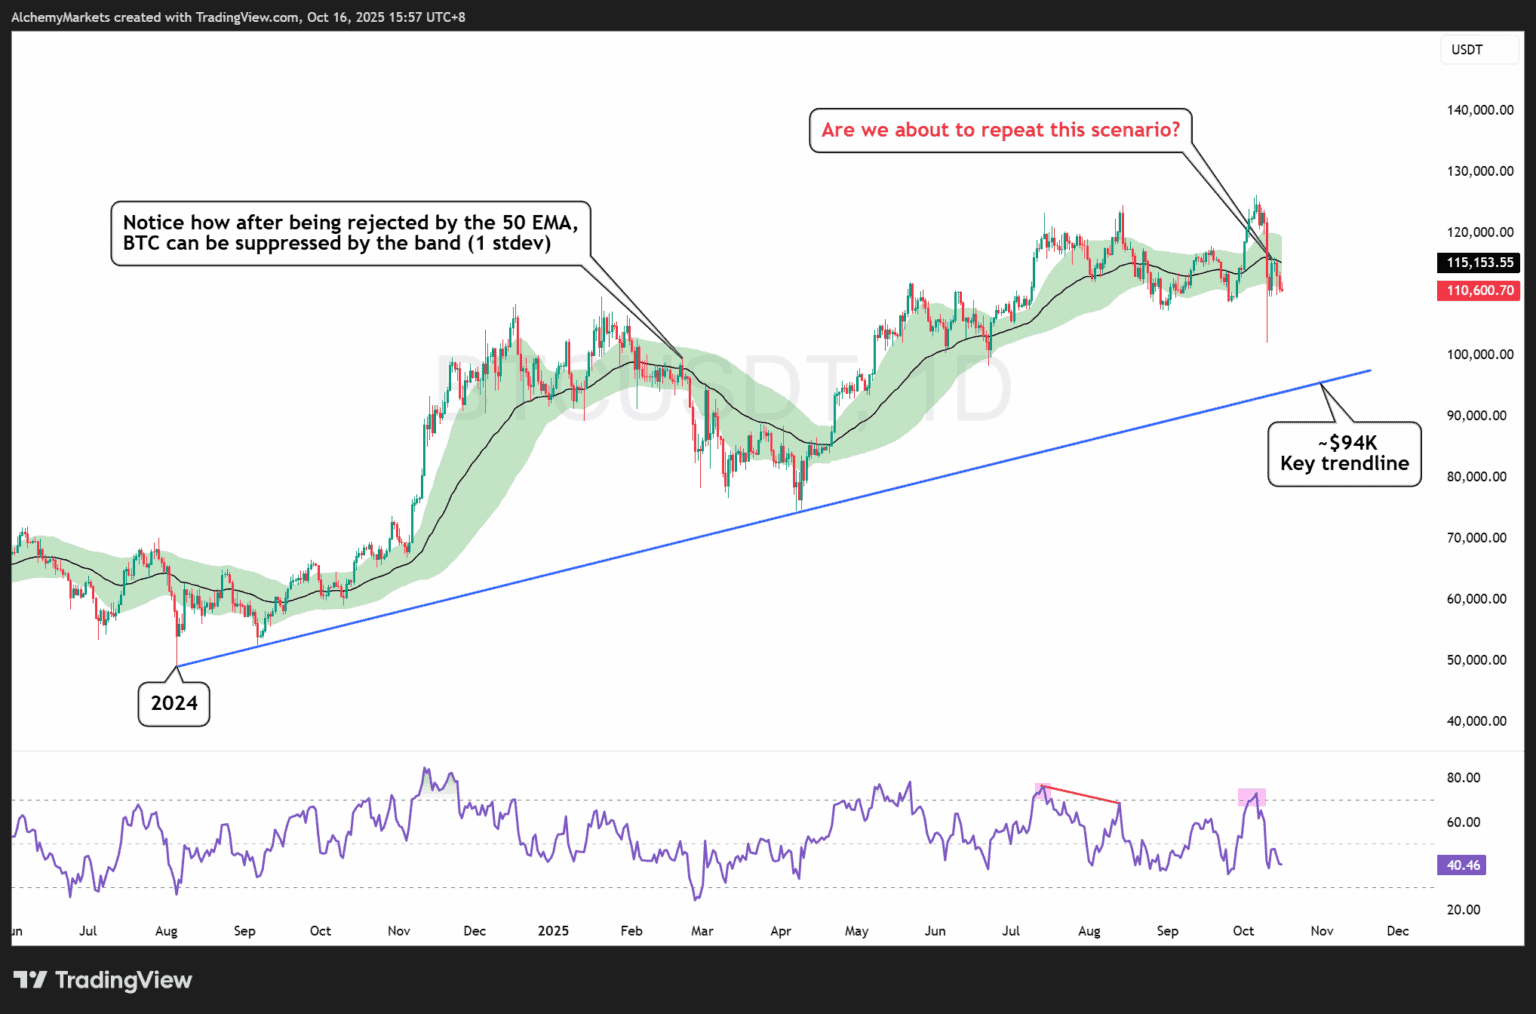
The 50 EMA Bollinger Band® (green) remains a critical trend filter. Earlier this year, when Bitcoin fell beneath the band, it triggered a prolonged slide to $80K, where the band flipped into firm resistance.
At present, Bitcoin has again failed to hold above the 50 EMA, rejecting from around $115K and drifting back below it; a sign that a similar setup could be forming.
There’s also a larger ascending trendline from 2024 that could act as deeper structural support should another cascade unfold. That line currently intersects near $94K, implying a potential >20% correction from all-time highs, historically a common retracement for Bitcoin.
Before that, however, several nearer-term levels deserve attention.
Levels to watch on Bitcoin
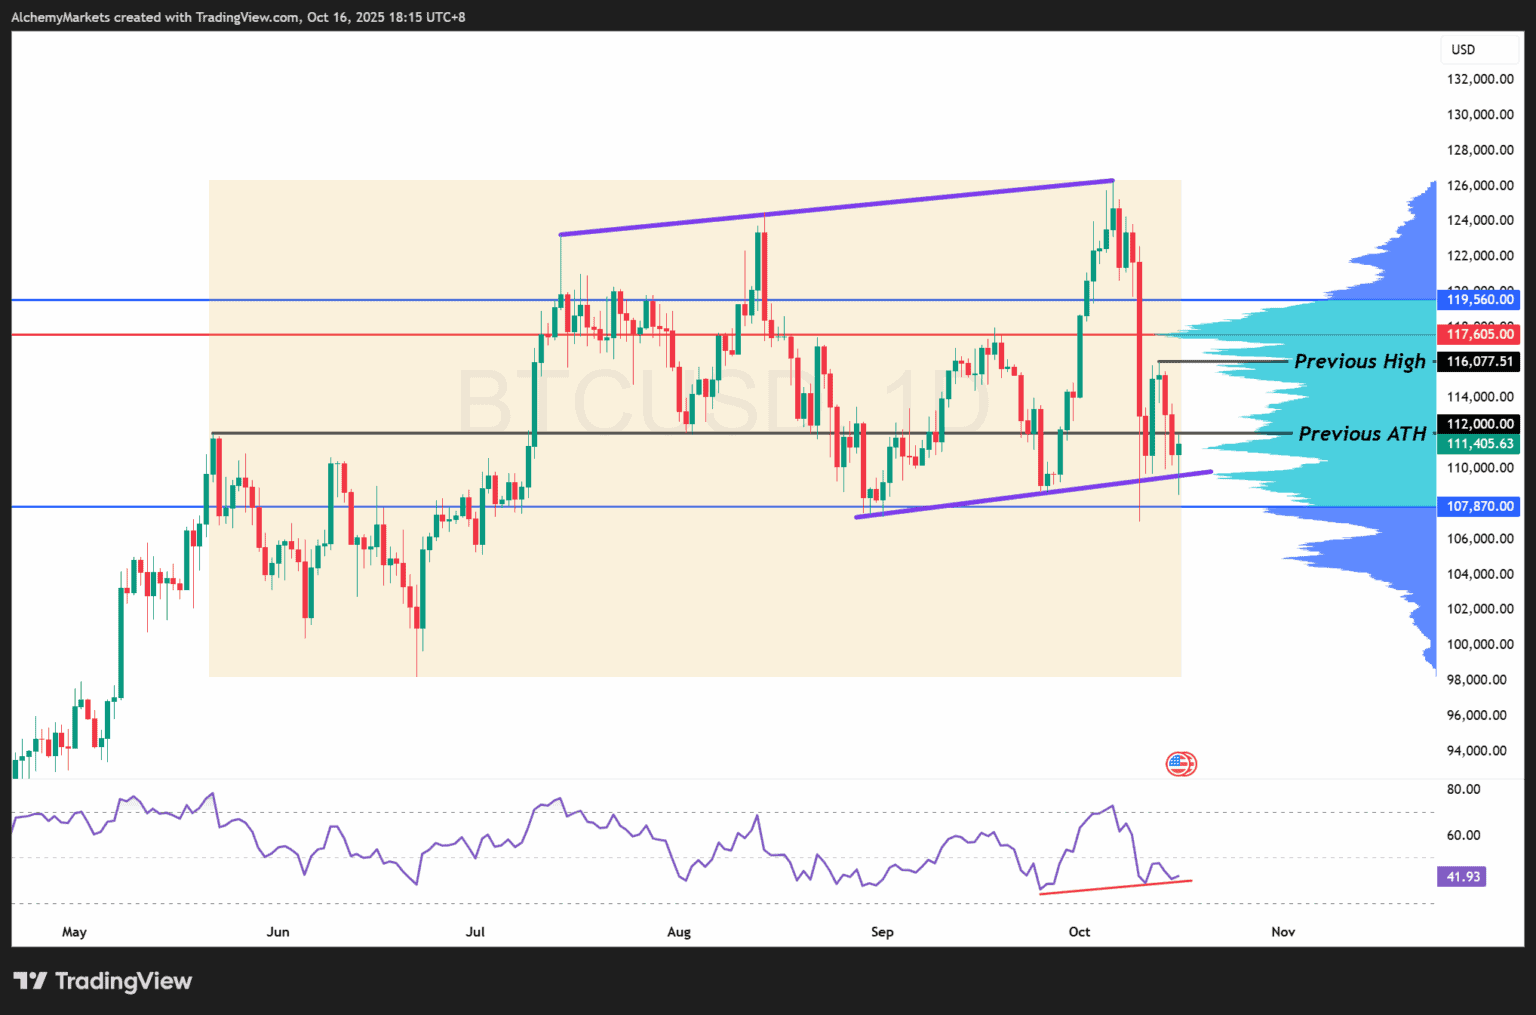
Anchored Volume Profile (mid-2025 anchor) still highlights $110K as the near-term pivot. The next liquidity pocket lies around $107,800, while resistance holds between $112K–$115K.
Key zones:
-
$112K: First ATH of the year.
-
$116K: Previous high aligned with 50-EMA.
-
$110K: Current support/pivot zone.
-
$109K: Minor ascending trendline support.
-
$107.8K: Value-area low (VAL).
Momentum remains fragile; a decisive break below the RSI’s rising trendline could drag readings toward the oversold 30 zone, signalling more potential downside.
However, once we reach the oversold zone, it’s a signal of seller exhaustion and improved conditions for a short-term relief rally or reversal.
A minor ascending trendline from late August is also converging near $109K. That level has been tapped but we need to see it hold with a daily close higher. Unless Bitcoin reclaims $112K soon, the current move risks being just another dead-cat bounce before deeper pressure resumes.
Sentiment and liquidation data
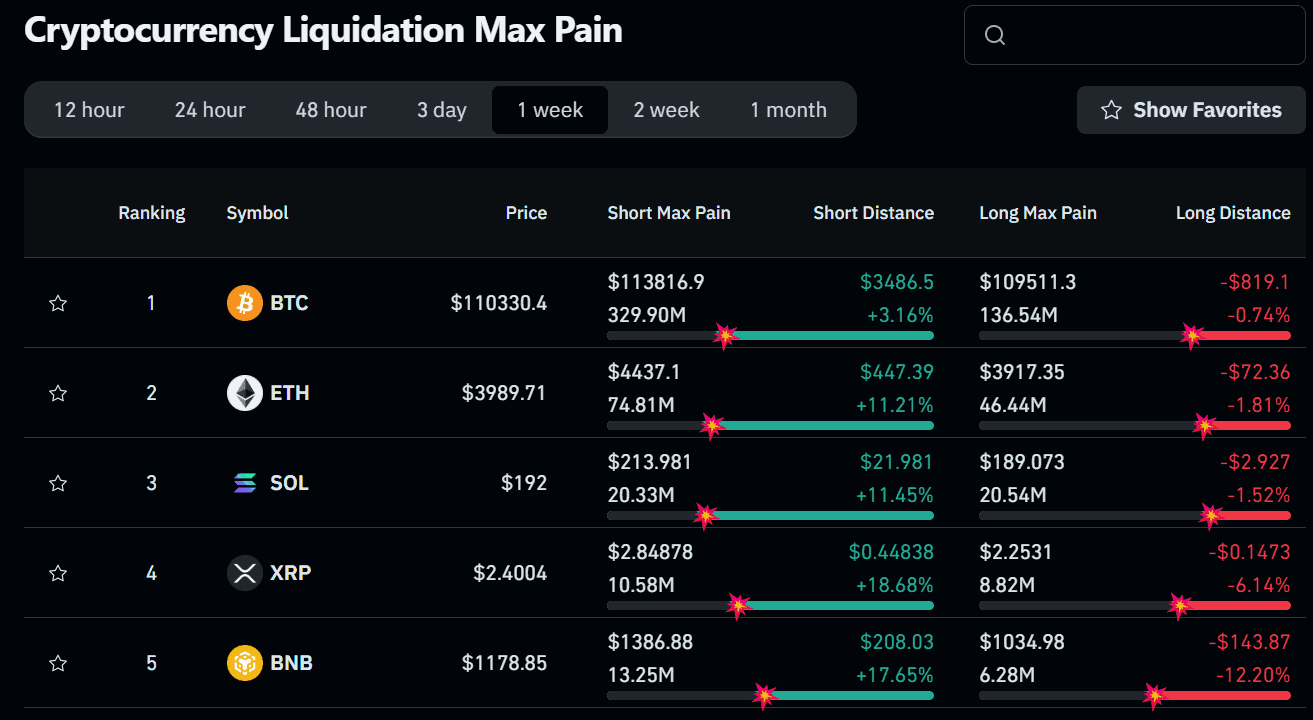
Source: Coinglass
According to Coinglass, max pain for longs has already reached near $109,500, suggesting the bulk of forced selling may have played out. However, max pain for shorts remains higher, meaning a squeeze scenario can’t be ruled out if BTC pushes through $113K with conviction and volume.
For now, the market stays in limbo — caught between exhaustion and potential reversal.
A daily close above $113K would shift bias toward a short-term squeeze, while a break below $109K risks dragging Bitcoin toward deeper support at $107,800.
Author

Zorrays Junaid
Alchemy Markets
Zorrays Junaid has extensive combined experience in the financial markets as a portfolio manager and trading coach. More recently, he is an Analyst with Alchemy Markets, and has contributed to DailyFX and Elliott Wave Forecast in the past.


