Bitcoin just proved its safe-haven status
- Bitcoin's retreat may have confirmed its safe-haven status.
- Technical factors are also behind the Bitcoin's downside correction.

BTC/USD has retreated from the recent high of $8,464 hit on Wednesday, January 8. At the time of writing, Bitcoin is changing hands at $7,880, down nearly 7% from the recent peak. The coin is moving within a short-term bearish trend that may gain traction as the price slides below important support levels.
Risk sentiment correlation
Many traders see Bitcoin's decline as a confirmation of its safe-haven status. A cryptocurrency research company Mrssari posted a chart to illustrate Bitcoin's correlation with the developments in Iran.
Bitcoin and the Iran conflict: Is $BTC becoming Digital Gold?
The chart shows that Bitcoin started the decline when US President Donald Trump expressed the desire to de-escalate the conflict. Notably, gold also responded with the sell-off; the Japanese Yen, a traditional safe-haven currency extended the decline.
While the correlation seems to be clear, not everyone buys this Bitcoin risk-off story, pointing out that statistics for a couple of days are not enough to draw conclusions. Also, there were other factors at play that might have influenced Bitcoin's price, such as a sudden increase of Tether market value on CoinMarketCap and the China blockchain announcement.
Pure technical play?
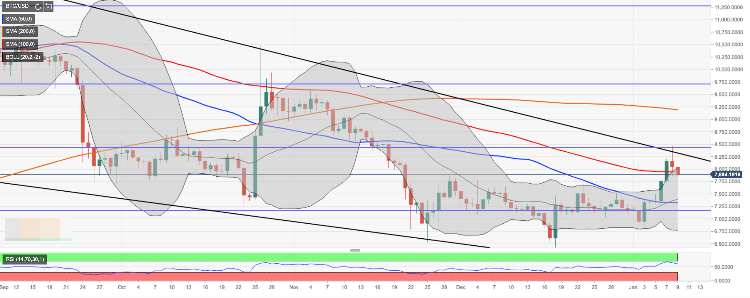
From the technical point of view, BTC/USD tried to break above the upper boundary of the descending wedge. A failure to settle above this barrier initiated the downside correction and pushed the price towards the next support created by psychological $8,000 and SMA100 daily. As this barrier gave way, the sell-off gained traction. The nearest backstop is created by SMA50 weekly at $7,600. It is followed by SMA50 daily on approach to $7,300.
On the upside, we will need to see a sustainable move of $8,000 for the upside to gain traction. Once this happens, the above-said descending wedge boundary (now at $8,320) and the recent high of $8,464 will come back in play. This area is reinforced by 50% Fibo retracement for the upside move from December 2018 low to July 2019 high. Once it is out of the way, the upside is likely to gain traction with the next focus on psychological $9,000 and SMA200 daily at $9,200.
BTC/USD daily chart
Author

Tanya Abrosimova
Independent Analyst