Bitcoin is hot: Massive breakout above $20k top
-
Bitcoin (BTC/USD) has finally done it: price action managed to break above the $20,000 (20k) resistance and the all time high of 2017 yesterday.
-
The main questions racing through every trader’s mind are simple: will the trend continue? And if yes, how much pullback (discount) can be expected? Let’s review.
-
The pullback pattern will be key for understanding whether the uptrend can continue. If there is a shallow one, then it will probably be a wave 4 (orange) with more upside left.

Price Charts and Technical Analysis
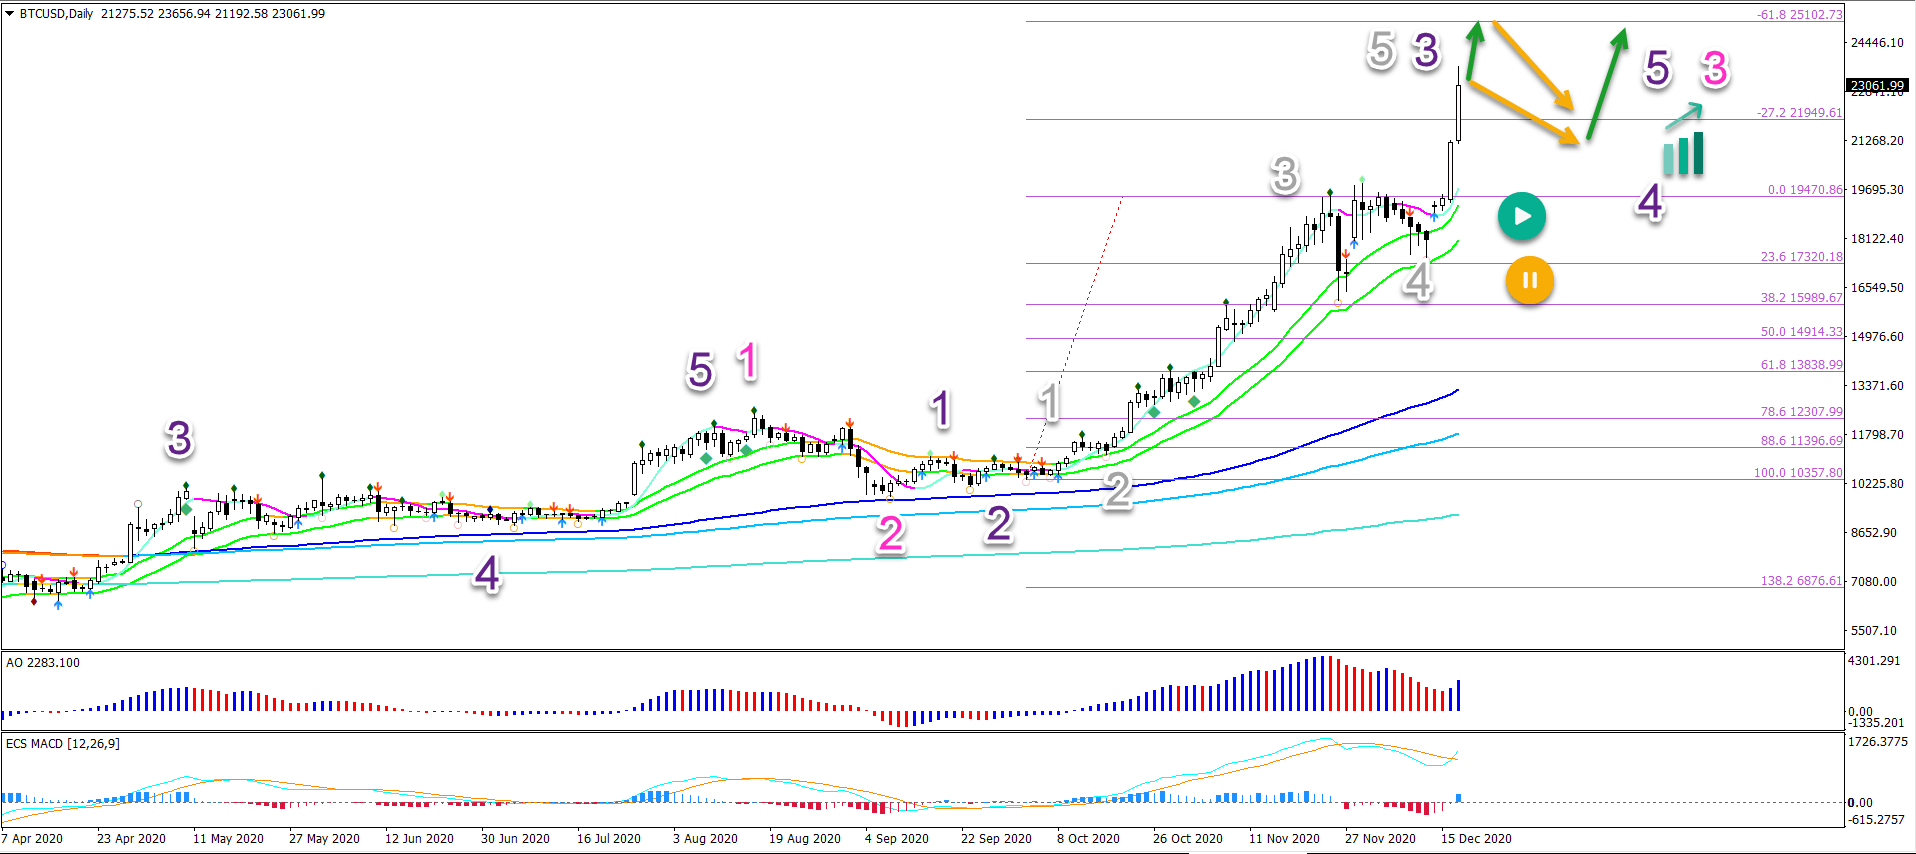
The BTC/USD’s third attempt to break above the 20k resistance zone finally worked. Price action went sideways at the resistance zone, which indicated that there were no sellers pushing price lower.
The consolidation zone at the 20k resistance indicates a wave 4 (grey) pattern. The swift break above the -27.2% Fibonacci target is indicating strong momentum as well. Typical for a wave 3 (purple) pattern.
The volatile price action will be a difficult read. But an uptrend continuation is very likely to take place. The first target is the -61.8% Fibonacci level at $25,000. Higher targets could be $26,500 and then $27,500 followed by the round $30k level.
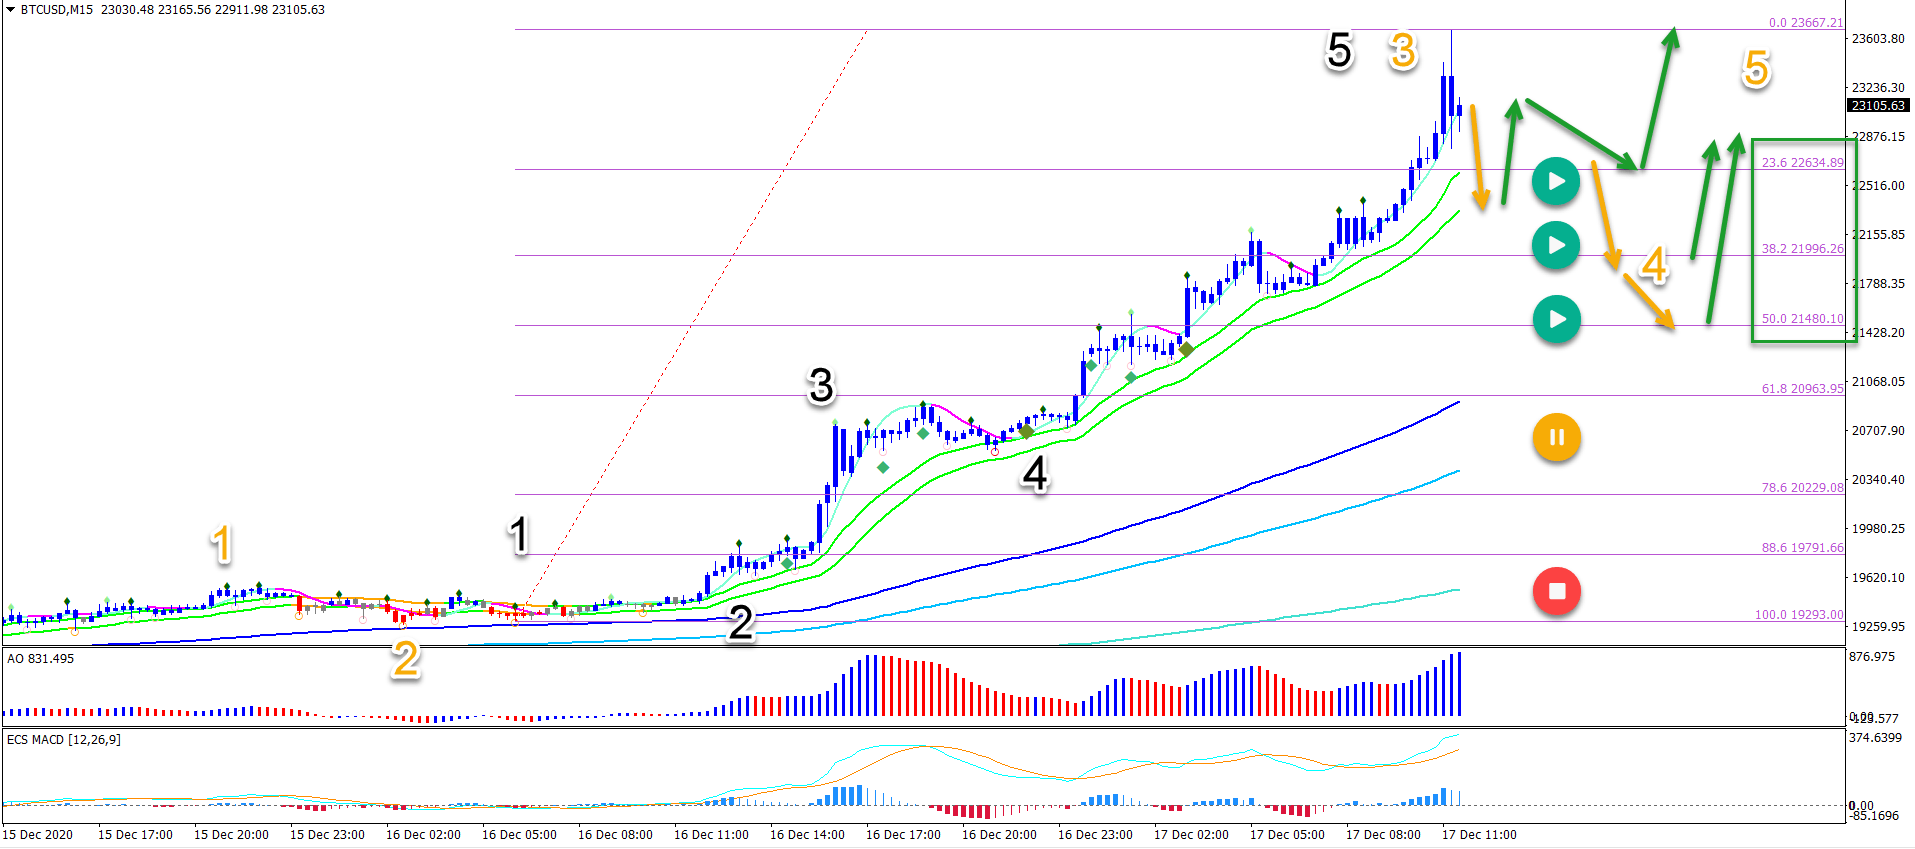
On the 15 minute chart, price action seems to have completed a strong bullish swing. This has been labelled as a wave 3 (orange) for now. But it will depend on the type of retracement.
-
A mild pullback that stays above the 50-61.8% Fibonacci retracement levels could indicate an uptrend continuation.
-
A strong bearish push might indicate that the break above the top was a short lived bull run.
The analysis has been done with the ecs.SWAT method and ebook.
Author

Chris Svorcik
FS method
Chris Svorcik is a trader, analyst, and educator with over 15 years of experience in financial markets, specializing in moving averages, market structure, and price patterns.


