Bitcoin hitting $31,000 might cost Dogecoin price its potential nine-week rally
- Dogecoin price exhibited a buy signal in the past week on the weekly chart, trading at $0.0638.
- The TD Sequential indicator suggests an uptrend for the next eight consecutive candles, which runs through mid-December in DOGE’s case.
- DOGE shares a -0.07 correlation with Bitcoin, which could act as a hurdle in the meme coin’s rally.

Dogecoin price is showing signs of the beginning of an uptrend after nearly three months of downtrend. However, the biggest cryptocurrency in the world, Bitcoin, is standing in the way of a DOGE rally. If this obtrusion does not go away, DOGE might be doomed to witness a failure.
Dogecoin price rise signals buying
Dogecoin price, trading at $0.0638 at the time of writing, has managed to prevent a decline to September 2022 lows by rising 3.36% in the past week. This was followed by another 3.74% rise in the past 24 hours on Binance, which was preceded by a buy signal, according to the TD Sequential.
The TD Sequential is an indicator that is used to identify the exact time of trend exhaustion and price reversal. In the condition where the indicator is being set up (i.e., the trend is initiating), the phase is expected to last up to nine candles. After its completion, the indicator identifies a likely top or bottom.
This is followed by the countdown phase, during which the active trend ends and a reversal takes place. This phase can extend up to 13 candles unless external factors interfere with the momentum.
In the case of Dogecoin, the last time the trend was set up (buy signal noted), it lasted for only four weeks before exhausting. The reversal led to a downtrend that began in mid-July and then ended last week.
On the weekly time frame, the DOGE trend accounts for a 12-candle count, nearly upholding the TD Sequential theory. Considering the same, the present uptrend could last for eight more consecutive candlesticks, which places the point of exhaustion in mid-December.
The resultant rally could even potentially push DOGE beyond $0.0700.

DOGE/USD 1-week chart
Nevertheless, the volatility of the market could even result in the uptrend being cut short and Dogecoin price seeing a decline toward the support level of $0.0602. Losing this support would invalidate the bullish thesis and bring DOGE down to September 2022 lows.
Bitcoin is a threat
Bitcoin is not only the leader of the crypto market but also a threat to Dogecoin. While not directly, the correlation it shares with the meme coin is certainly a matter of concern. At the moment, BTC and DOGE have a negative correlation of -0.07, which suggests that their price action is largely uncorrelated
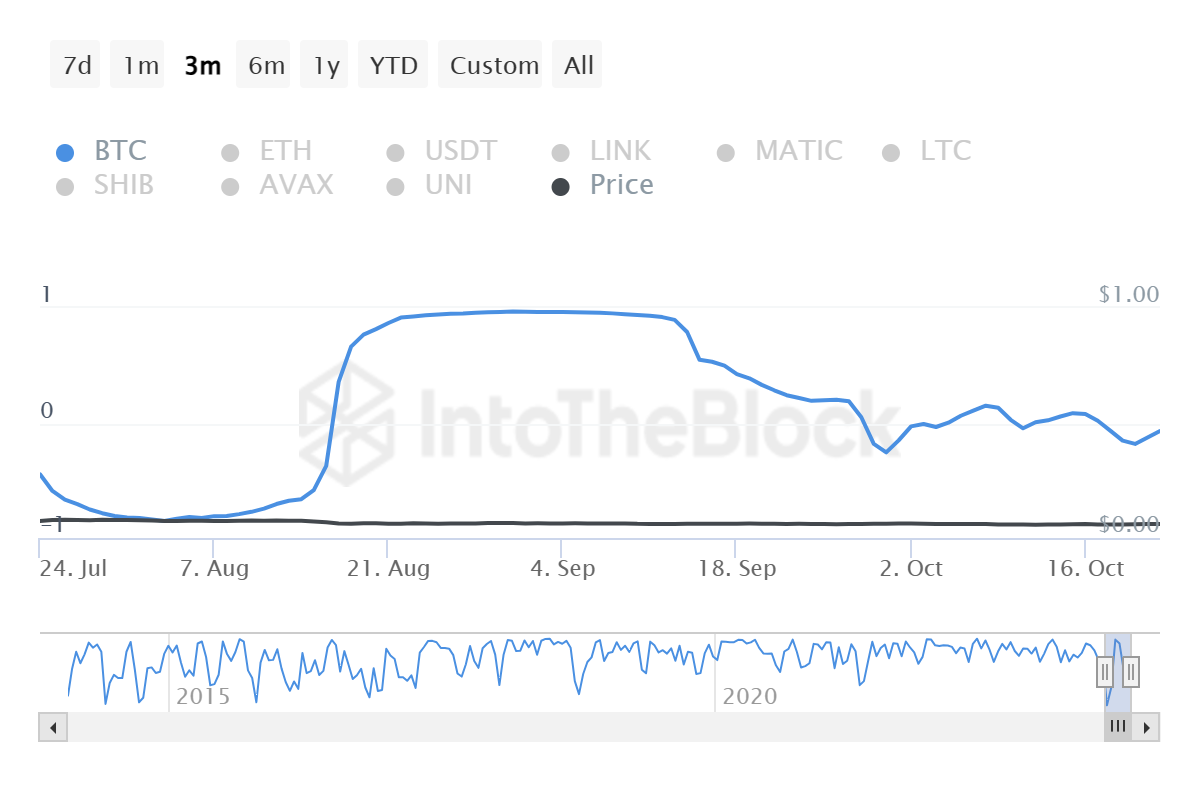
Dogecoin correlation with Bitcoin
Thus, the rising Bitcoin price could prove to be a threat to the Dogecoin price’s rally, and given that BTC just crossed the $31,000 mark during the intra-day high, bearishness for DOGE seems likely.
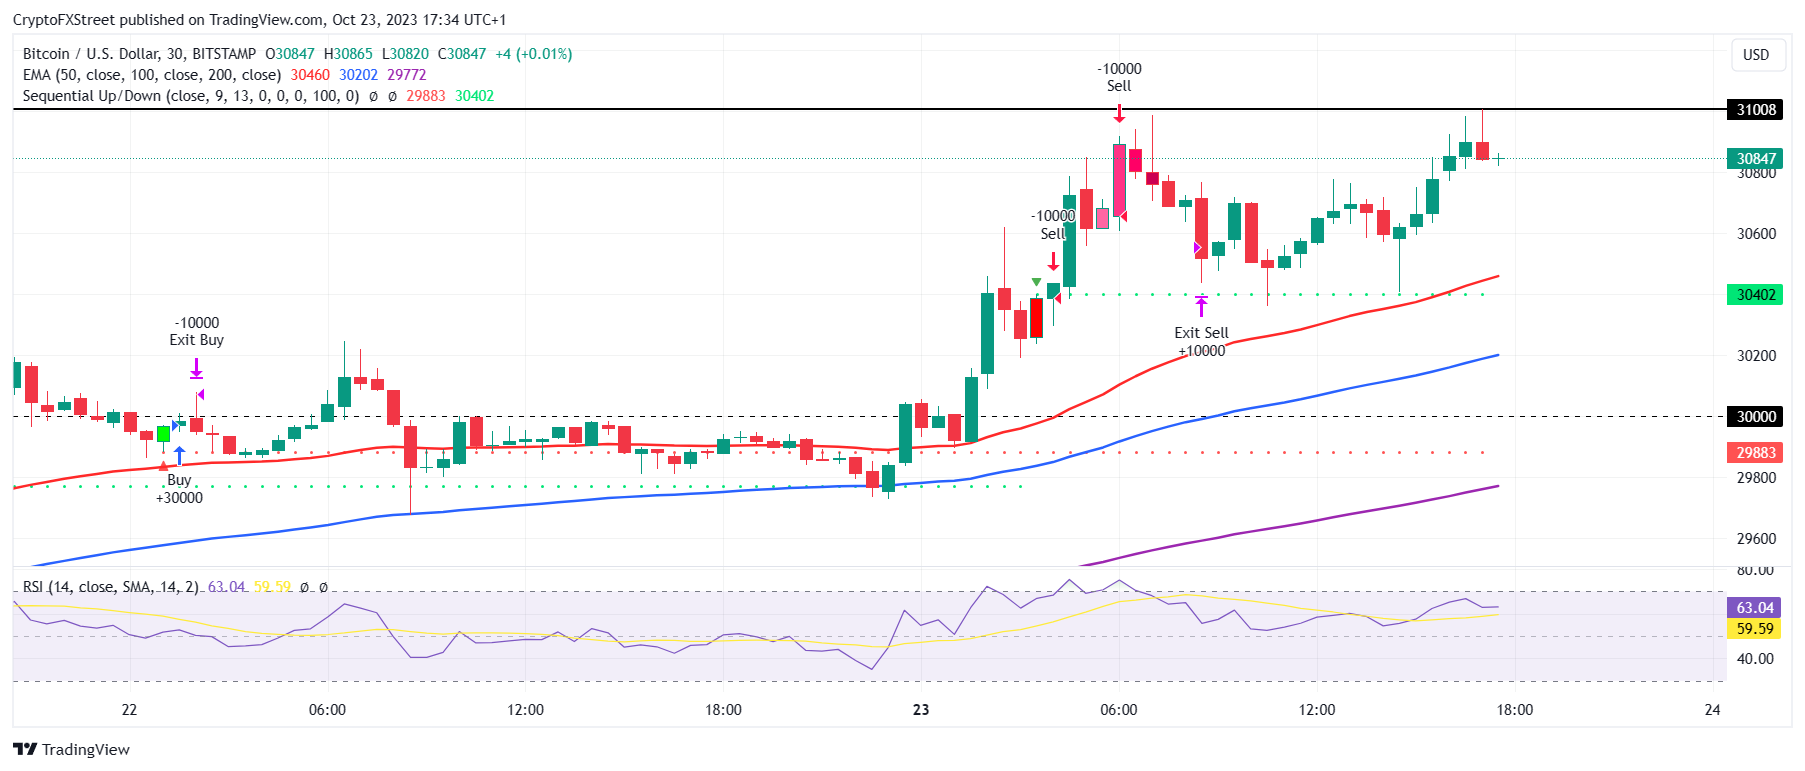
BTC/USD 1-day chart
Cryptocurrency metrics FAQs
What is circulating supply?
The developer or creator of each cryptocurrency decides on the total number of tokens that can be minted or issued. Only a certain number of these assets can be minted by mining, staking or other mechanisms. This is defined by the algorithm of the underlying blockchain technology. Since its inception, a total of 19,445,656 BTCs have been mined, which is the circulating supply of Bitcoin. On the other hand, circulating supply can also be decreased via actions such as burning tokens, or mistakenly sending assets to addresses of other incompatible blockchains.
What is market capitalization?
Market capitalization is the result of multiplying the circulating supply of a certain asset by the asset’s current market value. For Bitcoin, the market capitalization at the beginning of August 2023 is above $570 billion, which is the result of the more than 19 million BTC in circulation multiplied by the Bitcoin price around $29,600.
What is trading volume?
Trading volume refers to the total number of tokens for a specific asset that has been transacted or exchanged between buyers and sellers within set trading hours, for example, 24 hours. It is used to gauge market sentiment, this metric combines all volumes on centralized exchanges and decentralized exchanges. Increasing trading volume often denotes the demand for a certain asset as more people are buying and selling the cryptocurrency.
What is funding rate?
Funding rates are a concept designed to encourage traders to take positions and ensure perpetual contract prices match spot markets. It defines a mechanism by exchanges to ensure that future prices and index prices periodic payments regularly converge. When the funding rate is positive, the price of the perpetual contract is higher than the mark price. This means traders who are bullish and have opened long positions pay traders who are in short positions. On the other hand, a negative funding rate means perpetual prices are below the mark price, and hence traders with short positions pay traders who have opened long positions.
Author

Aaryamann Shrivastava
FXStreet
Aaryamann Shrivastava is a Cryptocurrency journalist and market analyst with over 1,000 articles under his name. Graduated with an Honours in Journalism, he has been part of the crypto industry for more than a year now.


