Bitcoin hit the 200 day moving average resistance at 40500/800

Bitcoin topped exactly at 200 day moving average at 40500/800 keeping the outlook negative over the weekend. Holding below 38000 adds pressure for today.
Ripple XRP shorts at 38.2% Fibonacci & short term moving average resistance at 1.0515/1.0545 work this week as we look for another test of 0.9000/0.8970.
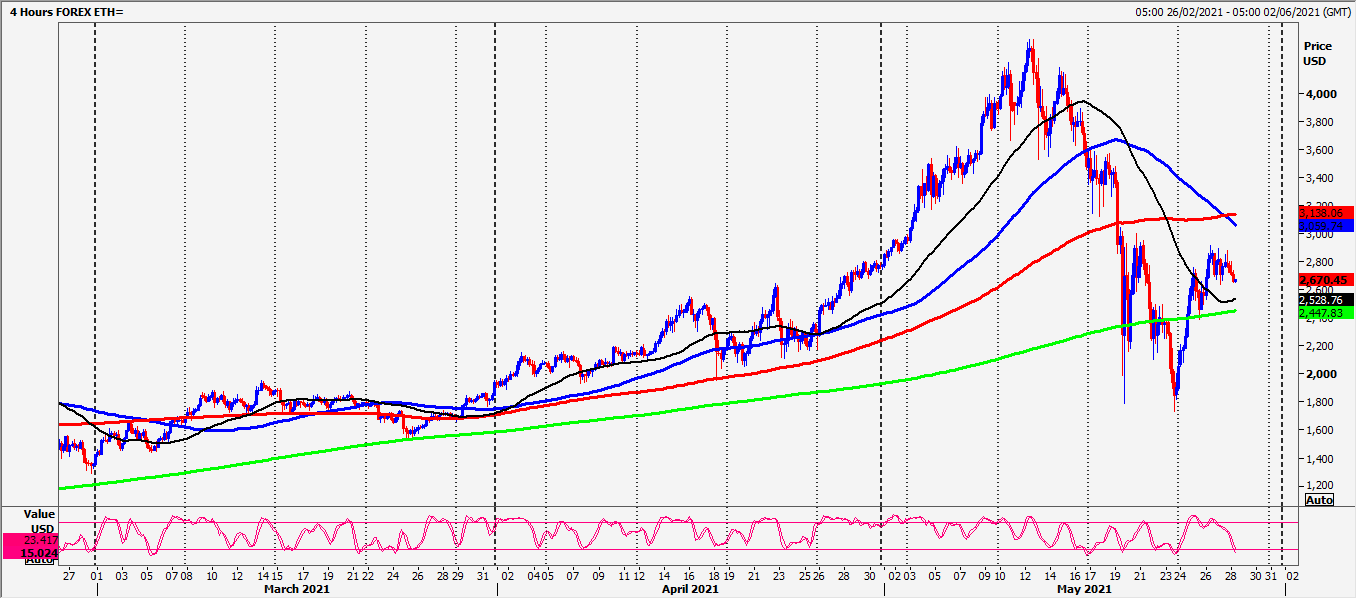
Ethereum shorts at strong resistance at 2750/2800are working as we look for a retest of first support at 2400/2350.
Daily analysis
Bitcoin hit the 200 day moving average resistance at 40500/800 exactly as predicted & topped exactly here. Shorts need stops above 41000. A break higher is a buy signal targeting the head & shoulders neckline at 43600/43800. Shorts need stops above 44000.
Shorts at the 200 day moving average resistance at 40500/800 target 38800/700, perhaps as far as minor support at 37100/37000 (our target for today). Further losses risk a slide to 35500 & a retest of strong support at 31100/30000, just above my ultimate target for the head & shoulders sell signal at 27500/27000.
Brave bulls can try longs again at 31100/30000 but be aware that my ultimate target for the crash was 27500/27000. So save some funds to add to longs here. However longs need stops below 25500. A break lower signals significant further losses are likely.
Ripple shorts at strong resistance at 1.0515/1.0545 re-target first support at 0.9000/0.8980, perhaps as far as 0.8050/30. Again expect very important 6 month trend line & 200 day moving average support at 0.7040-0.6558 to hold the downside. Brave bulls or longer term investors can try longs with stops below 0.6400. If prices hold below here then all is lost for the bulls & a further significant correction to the downside looks likely. Initially we can target 0.5100 – 0.4800.
Important 38.2% Fibonacci & short term moving average resistance at 1.0515/1.0545. Shorts need stops above 1.1100. A break higher is a buy signal targeting 1.1700/1.1800, perhaps as far as 1.3000/1.3500.
Ethereum shorts at strong resistance at 2750/2800 need stops above 2900. A break higher is a buy signal targeting 3050/3100, perhaps as far as strong resistance at 3300/3400. Shorts need stops above 3500.
Shorts at 2750/2800 target minor support again at 2400/2350. A break lower targets 2140/30 before a retest of important 61.8% Fibonacci support at 1728. Brave bulls can try longs here again & can also average down, buying a little more at the 200 day moving average at 1600. It is entirely possible that this will be the low for the crash. Longs MUST stop below 1500. A break lower to kills the recovery hopes & risks a slide to to 1300/1250. Although the decline may pause here I do not see this as a strong support level & longs would be extremely risky.
Chart
Author

Jason Sen
DayTradeIdeas.co.uk
Jason Sen began his career in the options pits on the trading floor of LIFFE in 1987 at the age of 19, making markets on his own account. In 2001 when the trading floor closed he successfully made the transition to day trading on computer screens.




