|

Bitcoin Gold price analysis: BTG/USD spiked up by 5.67% in just one hour

  • The RSI indicator in the one-hour BTG/USD chart is trending in the overbought zone.
  • The Elliott Oscillator in the BTG/USD chart shows seven straight bullish sessions.

BTG/USD went up from $7.95 to $8.36 so far today as the bulls took control for the second day in a row. The hourly breakdown shows us that BTG/USD spiked up from $7.95 to $8.40 in just one hour. It seems like the market has found short-term resistance at $8.40 and has since dipped a little bit to $8.36. As the one-hour chart below shows, the price is currently consolidating in a flag formation, getting primed for another potential breakout.

BTG/USD hourly chart

fxsoriginal

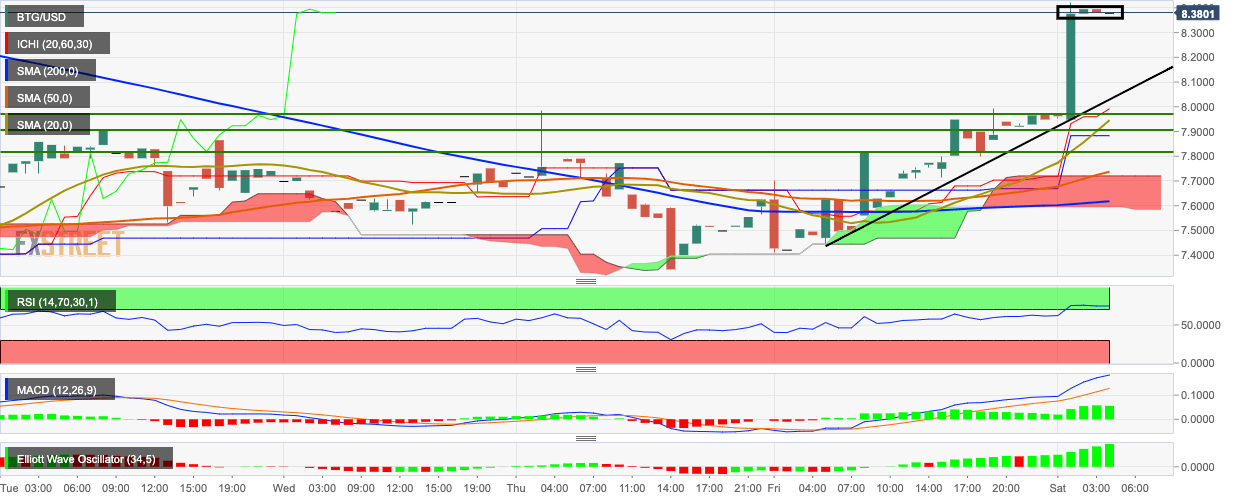
The one-hour chart has found support on the upward trending line and is currently floating above the red Ichimoku cloud, SMA 200, SMA 50 and SMA 20. The Relative Strength Index (RSI) indicator inside the overbought zone, while the Elliott Oscillator shows seven straight bullish sessions. The Moving Average Convergence/Divergence (MACD) indicator shows us increasing bullish momentum in the short-term. 
 

Author

Rajarshi Mitra

Rajarshi Mitra

Independent Analyst

Rajarshi entered the blockchain space in 2016. He is a blockchain researcher who has worked for Blockgeeks and has done research work for several ICOs. He gets regularly invited to give talks on the blockchain technology and cryptocurrencies.

More from Rajarshi Mitra
Share:

Editor's Picks

Ripple extends losses as derivatives interest cools

Ripple (XRP) extends its bearish roll near $1.12 support on Friday, reflecting intense headwinds in the broader crypto market largely attributable to macroeconomic pressure.

Crypto Today: Bitcoin, Ethereum, XRP weaken further as capital outflows persist

Macroeconomic headwinds continue to weigh heavily on the cryptocurrency market on Friday, prompting major assets like Bitcoin (BTC) to pare earlier gains and extend losses after June’s brief relief rally.

Bitcoin Weekly Forecast: Recovery hopes fade after the Fed spoils the party

Bitcoin is set to end the week in the red, trading near the 200-Week Simple Moving Average at around $62,300 on Friday. Institutional selling persists, capping BTC’s recovery as spot Exchange Traded Funds point to a sixth consecutive week of outflows.

Sui risks a deeper bearish leg despite on-chain resilience

Sui is down 2% on Friday, extending its decline toward the recent support leg formed at $0.6618. The Total Value Locked in the Sui ecosystem has stabilized around 600 million SUI tokens, reflecting resilient user demand.

Bitcoin: Recovery hopes fade after the Fed spoils the party
Bitcoin (BTC) is set to end the week in the red, trading near the 200-Week Simple Moving Average (SMA) at around $62,300 on Friday. Institutional selling persists, capping BTC’s recovery as spot Exchange Traded Funds (ETFs) point to a sixth consecutive week of outflows.