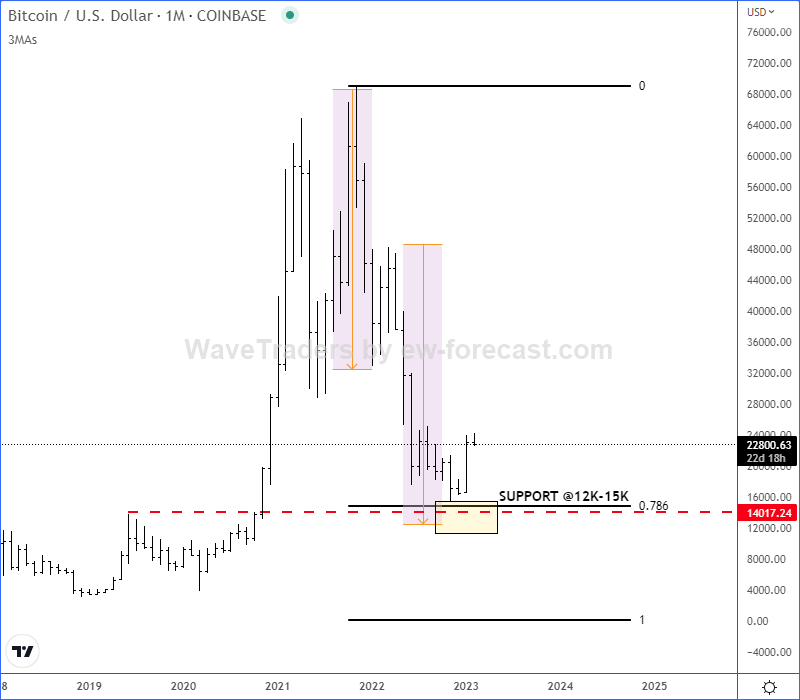
Bitcoin found an interesting support

Bitcoin has been in a massive decline over the last year, but it stopped at interesting technical support levels, from where we may see a recovery, at least for a temporary period of time. Looking at the monthly chart, we can see it stopped at important 78,6% Fibonacci retracement that can act as a reversal point, especially if we consider important support zone between 2017 and 2019 highs.

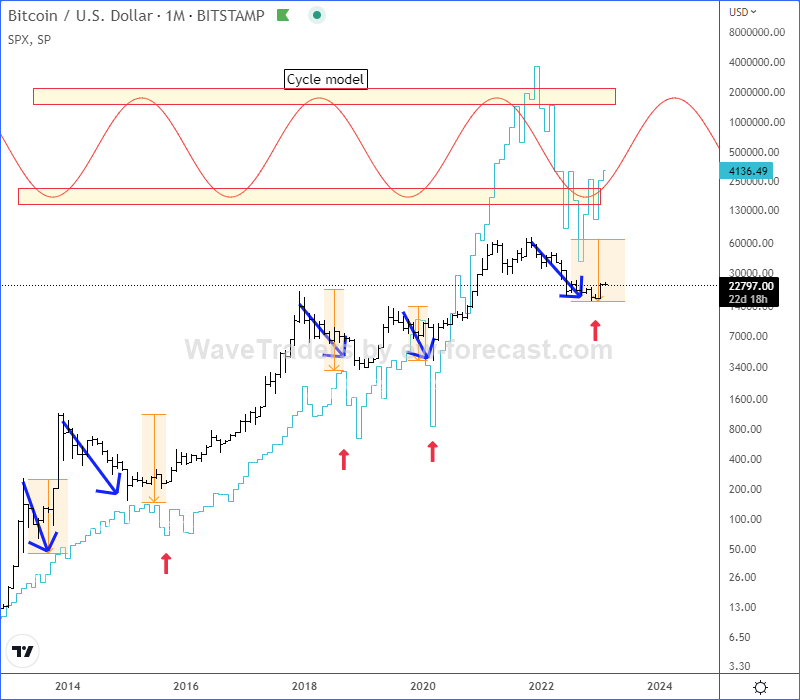
If we respect monthly logarithmic scale chart and cycle model with 70-80% corrections, then with positive correlation to SP500 we should be aware now of risk-on sentiment and bigger recovery.

If we respect monthly logarithmic scale chart and cycle model with 70-80% corrections, then with positive correlation to SP500 we should be aware now of risk-on sentiment and bigger recovery.
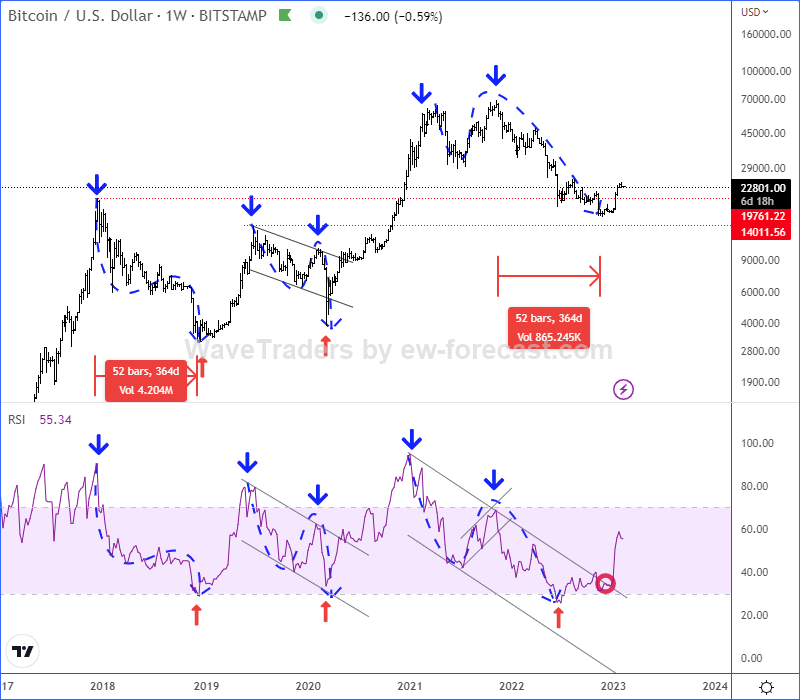
We also want to mention and highlight that Bitcoin is recovering after reaching extreme weekly RSI levels. Considering past data, we wouldn’t be surprised if support is already in place, at least temporary one. Now that RSI is on the way back to the upper side of a range, BTC could easily stay in the recovery mode.

Get Full Access To Our Premium Elliott Wave Analysis For 14 Days. Click here.
Get Full Access To Our Premium Elliott Wave Analysis For 14 Days. Click here.
Author

Gregor Horvat
Wavetraders
Experience Grega is based in Slovenia and has been in the Forex market since 2003.
More from Gregor Horvat


