Bitcoin eyes 200-day average after three-day price rally

Bullish signals for Bitcoin have emerged, favoring a continued price rally toward the widely tracked 200-day simple moving average (SMA), according to a technical analysis by Katie Stockton, the founder and managing partner of Fairlead Strategies.
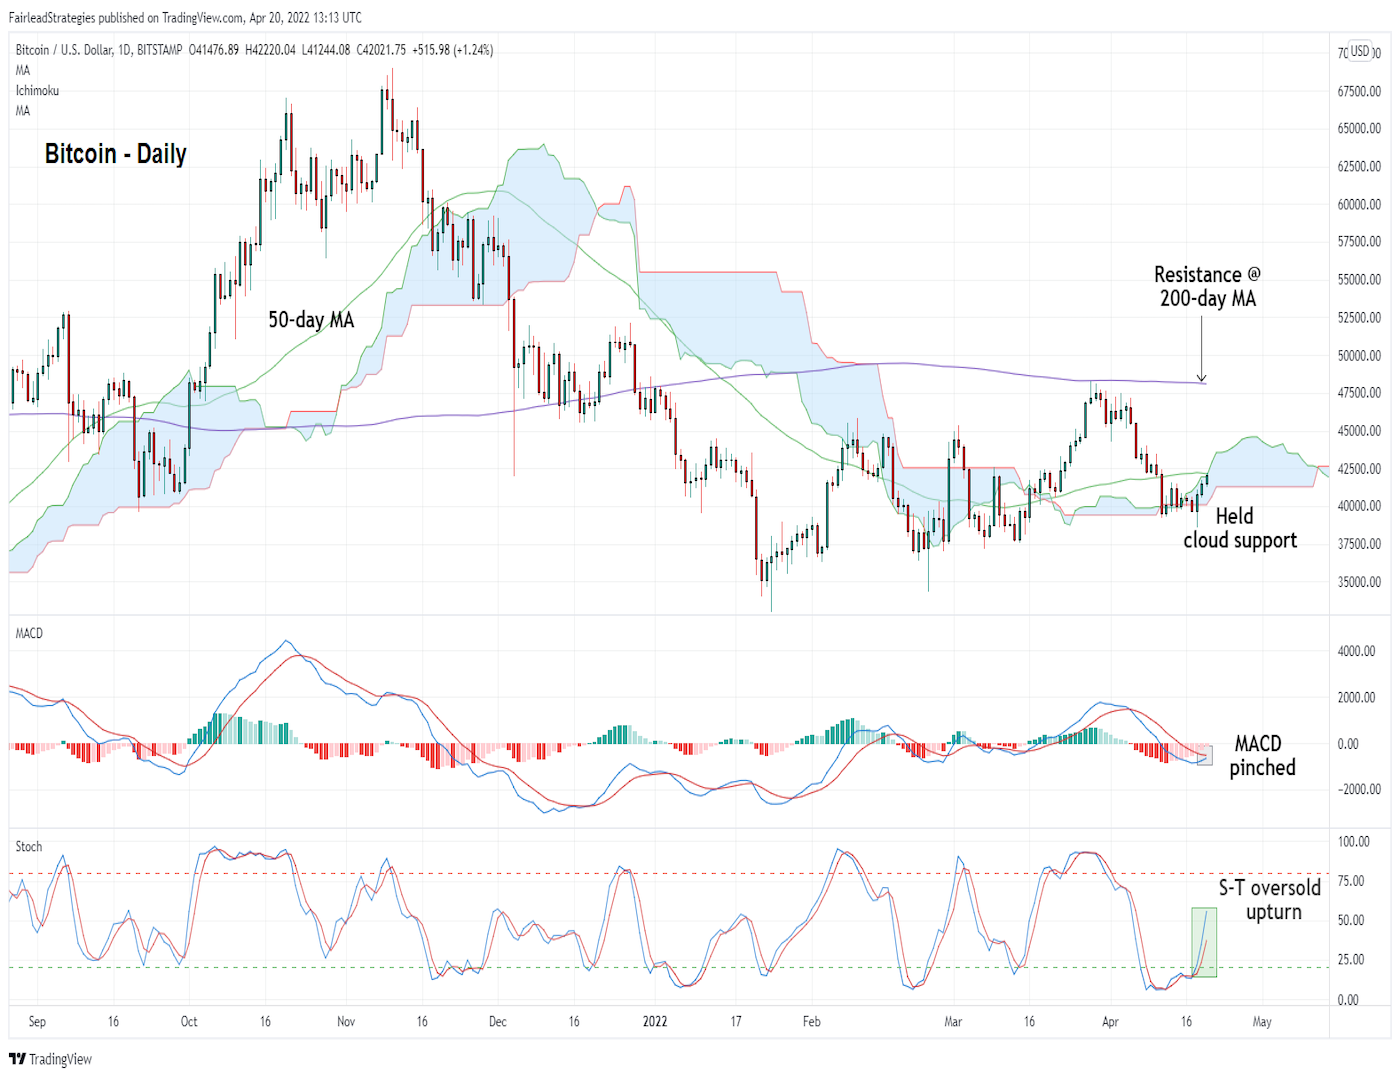
The daily chart shows the leading digital asset has risen from $38,500 to $42,200 in the past three days, defending the Ichimoku cloud support.
Created by Japanese journalist Goichi Hosoda in the late 1960s, the Ichimoku cloud comprises two lines – the leading span A and the leading span B. Both are plotted 26 days ahead of the last candle. The indicator is widely used to identify support and resistance, with crossovers above or below representing an advance warning of bullish or bearish breakouts.
The latest bullish defense is backed by positive signals from technical tools like stochastics and MACD histograms.
"Bitcoin held important cloud-based support near $40,000 and has generated an oversold 'buy' signal from the daily stochastics after a three-day rally, supporting a short-term bullish bias," Stockton said in an email. "The daily MACD is pinched as well, reflecting improved short-term momentum that supports a move higher toward next resistance near $48.1K, defined by the 200-day MA."
In technical analysis, stochastics are indicators that oscillate between 0 and 100, helping traders identify oversold and overbought conditions and trade entry and exit points. An asset is considered to be oversold when stochastics drop under 20, and overbought when they top 80. A turn higher from under 20 is taken as a buy signal.
The moving average convergence divergence (MACD) histogram is used to identify trend changes and trend strength. The indicator's positive/negative flips indicate bullish/bearish trend changes. Meanwhile, the "pinch" – declining bars or lower highs above the zero line and higher lows below the zero line represent bullish and bearish exhaustion.
The three-day rise has brought the 200-day SMA at $48,000 into focus. In late March, the average proved a tough nut to crack, stalling the recovery rally from lows near $37,500.
On the downside, Monday's low of $38,550 is the level to beat for the sellers.
Bitcoin was trading near $42,300, representing a 2% gain on the day, according to CoinDesk data.
Author

CoinDesk Analysis Team
CoinDesk
CoinDesk is the media platform for the next generation of investors exploring how cryptocurrencies and digital assets are contributing to the evolution of the global financial system.


