Bitcoin Cash technical analysis: BCH/USD trending in a flag formation, gets ready for a breakout
- BCH/USD went up from $304 to $307.20 this Tuesday.
- Moving average convergence/divergence (MACD) shows increasing bullish momentum.

BCH/USD daily chart
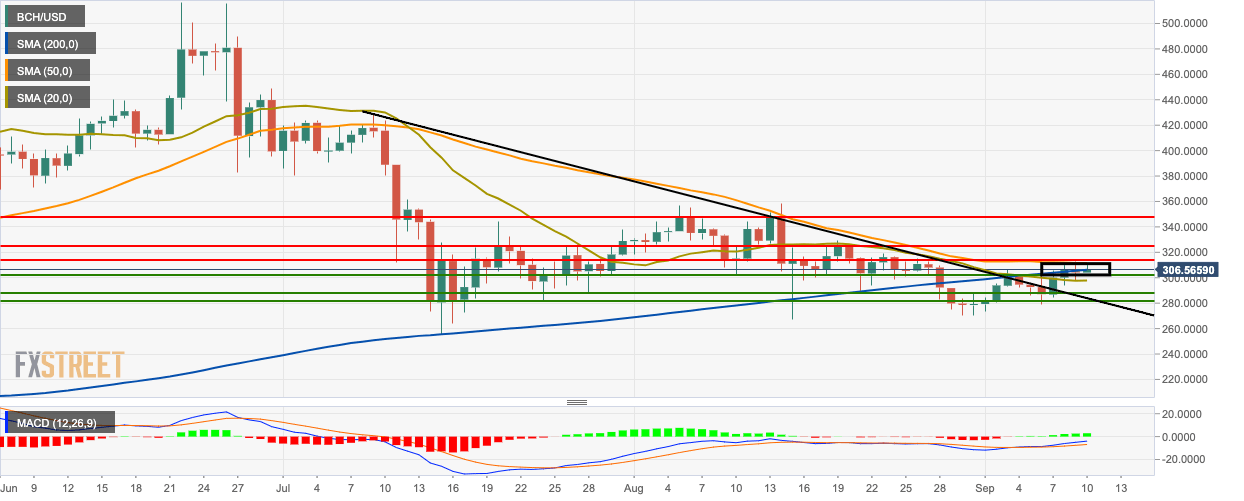
Over the last three sessions, BCH/USD is trending in a flag formation, getting primed for a breakout. This Tuesday the price has gone up from $304 to 307.20. Four days back, the price broke above the downward trending line and is above the 200-day simple moving average (SMA 200), SMA 50 and SMA 20 curves. The moving average convergence/divergence (MACD) shows increasing bullish momentum.
BCH/USD 4-hour chart
-637036869504880027.png)
The price broke above the green Ichimoku cloud and has found support on the upward trending line. The price has encountered resistance on the SMA 200 curve and is trending above the SMA 20 and SMA 50 curves. The Elliott oscillator has had two straight bullish sessions.
BCH/USD hourly chart
-637036868692672236.png)
The hourly chart is experiencing bearish correction and has found support on the upward trending line. The price has dropped slightly from $307.20 to $307. The price is trending above the SMA 200, SMA 50 and SMA 20 curves. The relative strength index (RSI) indicator is trending around 57.80.
Key Levels
Author

Rajarshi Mitra
Independent Analyst
Rajarshi entered the blockchain space in 2016. He is a blockchain researcher who has worked for Blockgeeks and has done research work for several ICOs. He gets regularly invited to give talks on the blockchain technology and cryptocurrencies.


