|

Bitcoin Cash technical analysis: BCH/USD has a bullish breakout from triangular formation

  • BCH/USD has gone up from $317 to $325 so far this Tuesday. 
  • SMA 20 curve acts as immediate market resistance.

BCH/USD daily chart

fxsoriginal

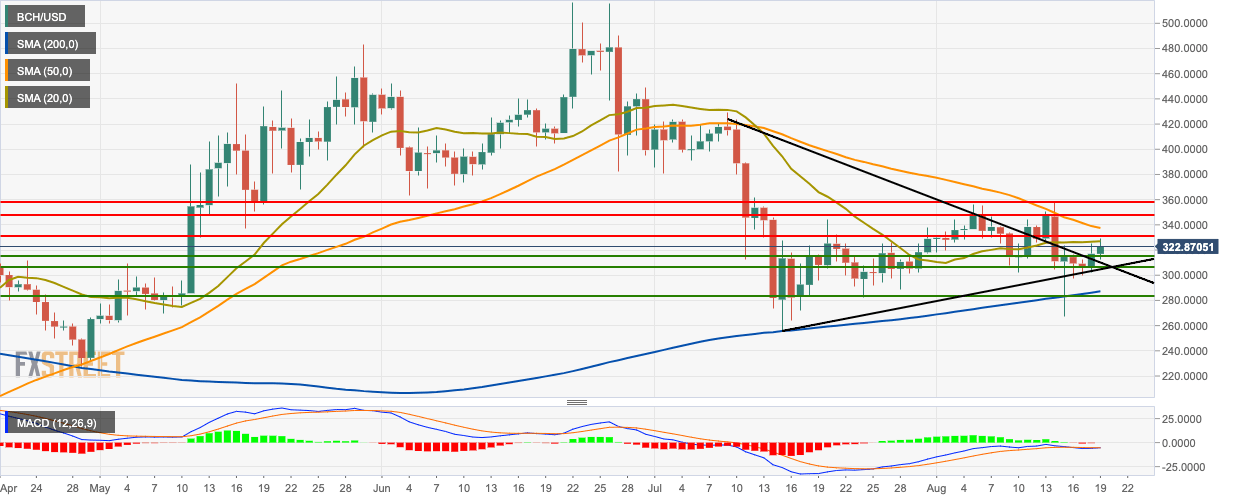
Follow two straight bullish days the BCH/USD price chart has had a bullish breakout from the triangle formation. Over this Tuesday, the price has gone up from $317 to $325. The 20-day simple moving average (SMA 20) curve is acting as immediate market resistance and is looking to cross over the SMA 50 curve. The moving average convergence/divergence (MACD) indicator shows decreasing bearish momentum,

BCH/USD 4-hour chart

fxsoriginal

The 4-hour BCH/USD is currently consolidating within the triangle formation. The chart shows that the price went up from $317 to $324.55 before falling to $320.50. Since then, the price went back up to $325. The 4-hour market is currently trending below the red Ichimoku cloud. The Elliot oscillator has had ten straight bullish sessions.

BCH/USD hourly chart

fxsoriginal

The hourly BCH/USD market has found support on the upward trending line. BCH/USD has been struggling at the $324 resistance line before breaking out to $325. The SMA 20 curve is crossing over the SMA 200 curve, which is a bullish sign. The relative strength index (RSI) indicator is trending around 60.60.

Key Levels

BCH/USD

Overview
Today last price324.4288
Today Daily Change7.4288
Today Daily Change %2.34
Today daily open317
 
Trends
Daily SMA20326.6768
Daily SMA50339.0086
Daily SMA100376.3128
Daily SMA200284.7934
Levels
Previous Daily High325.2039
Previous Daily Low302.3226
Previous Weekly High358.4945
Previous Weekly Low267.0256
Previous Monthly High428.8945
Previous Monthly Low255.06
Daily Fibonacci 38.2%316.4632
Daily Fibonacci 61.8%311.0632
Daily Pivot Point S1304.4804
Daily Pivot Point S2291.9608
Daily Pivot Point S3281.5991
Daily Pivot Point R1327.3618
Daily Pivot Point R2337.7235
Daily Pivot Point R3350.2431


Author

Rajarshi Mitra

Rajarshi Mitra

Independent Analyst

Rajarshi entered the blockchain space in 2016. He is a blockchain researcher who has worked for Blockgeeks and has done research work for several ICOs. He gets regularly invited to give talks on the blockchain technology and cryptocurrencies.

More from Rajarshi Mitra
Share:

Markets move fast. We move first.

Orange Juice Newsletter brings you expert driven insights - not headlines. Every day on your inbox.

By subscribing you agree to our Terms and conditions.

Editor's Picks

Pi Network Price Forecast: Bearish streak nears critical support trendline

Pi Network (PI) edges lower on Friday for the third consecutive day, approaching a local support trendline. The on-chain data suggests an increase in supply pressure as Centralized Exchanges (CEXs) experience a surge in inflows.

Top Crypto Gainers: Zcash rallies as MYX Finance, Dash test critical EMA levels

Zcash , MYX Finance, and Dash are the top-performing assets in the top 100 cryptocurrency list over the last 24 hours. The privacy coin leads the rally while MYX and DASH struggle to clear their 100-day Exponential Moving Averages (EMA).

XRP slides amid record on-chain activity, mixed technical signals

Ripple is trading under pressure at the time of writing on Thursday, after bulls failed to break the short-term resistance at $2.22. The reversal may extend toward Monday’s low of $1.98, especially if risk-off sentiment persists in the broader cryptocurrency market.

Aster lags recovery as perpetual DEX releases new roadmap on infrastructure, utility and ecosystem 

Aster is consolidating above $1.05 at the time of writing on Thursday, reflecting lethargic sentiment in the broader cryptocurrency market. The token native to the perpetual DEX had recovered from Monday's low of $0.88 but stalled around $1.08 on Wednesday.

Orange Juice Newsletter – Smart insights by real people. Every day.

A free newsletter highlighting key market trends to help traders stay a step ahead. Daily insights on the most relevant trading topics, compiled by our experts in an easy-to-read format so you never miss an important move.

Bitcoin: BTC steadies as data suggests local bottom

Bitcoin (BTC) hovers around $91,000 at the time of writing on Friday, extending its recovery by 5% so far this week. On the institutional front, a modest outflow from US-listed spot Bitcoin Exchange Traded Funds (ETFs) marks a slowdown from previous weeks and signals a reduction in selling pressure, further supporting BTC’s recovery.