|

Bitcoin Cash Price Analysis: BCH/USD has an opportunity to shoot higher

  • Bitcoin Cash price is trading in the red, with losses of 0.70% in the second half of the session.
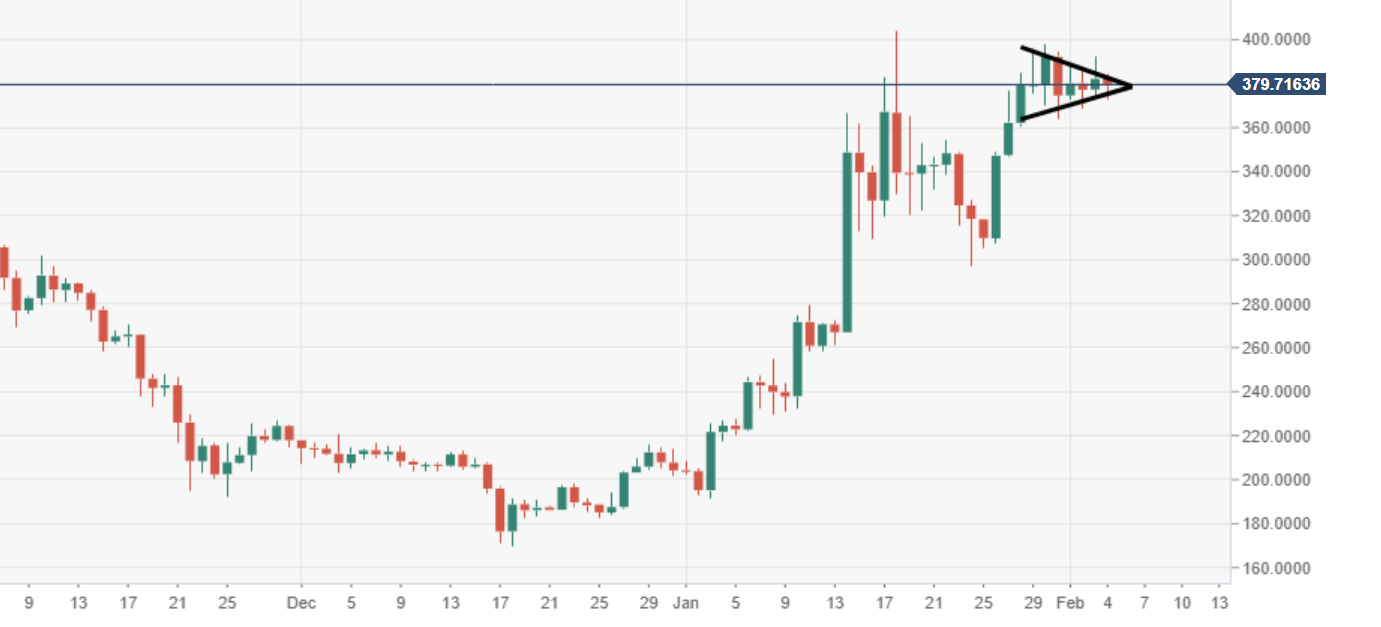
  • BCH/USD price action continues to move within a potential bullish pennant. 
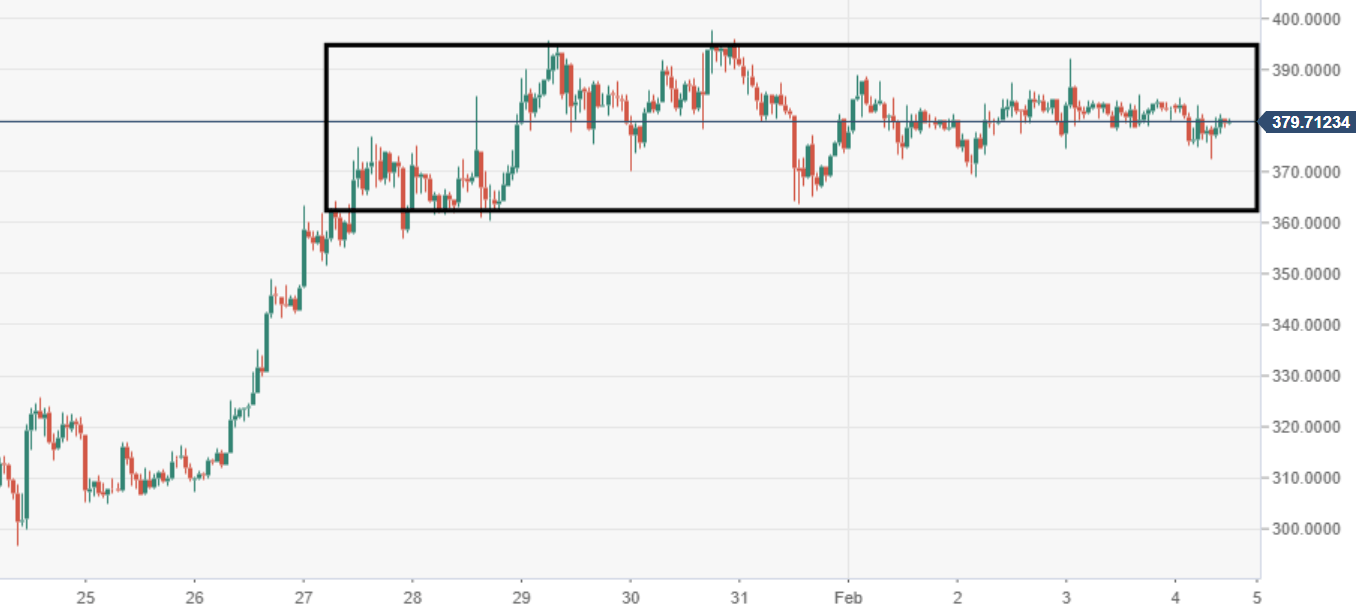
  • The range remains narrow; boundary to the upside at $390, to the downside $360. 

BCH/USD daily chart

The daily price action has been tight for going on seven sessions now, as the price consolidates. 
BCH/USD 60-minute chart

A range block formation is observed via the 60-minute chart view, awaiting the next committed move potentially from the bulls. 
Spot rate:                 379.67

Relative change:     -0.65%

High:                         384.54

Low:                          372.34

BCH/USD

Overview
Today last price379.6203
Today Daily Change-2.5627
Today Daily Change %-0.67
Today daily open382.183
 
Trends
Daily SMA20353.6773
Daily SMA50272.5352
Daily SMA100258.7163
Daily SMA200271.2625
 
Levels
Previous Daily High392.2721
Previous Daily Low374.4546
Previous Weekly High397.8693
Previous Weekly Low307.1881
Previous Monthly High404.3638
Previous Monthly Low191.7762
Daily Fibonacci 38.2%385.4658
Daily Fibonacci 61.8%381.2609
Daily Pivot Point S1373.6677
Daily Pivot Point S2365.1524
Daily Pivot Point S3355.8502
Daily Pivot Point R1391.4852
Daily Pivot Point R2400.7874
Daily Pivot Point R3409.3027

Author

Ken Chigbo

Ken Chigbo

Independent Analyst

Ken has over 8 years exposure to the financial markets. He started his career as an analyst, covering a variety of asset classes; forex, fixed income, commodities and equities.

More from Ken Chigbo

Share:

Editor's Picks

XRP consolidates as ETF inflows, rising derivatives interest offset selling pressure
Ripple (XRP) faces sustained selling pressure as bears maintain control on Monday. The remittance token has struggled to break above the $1.10 resistance since last Thursday, as risk sentiment weighs. Demand for XRP derivatives has gradually increased since last week, with the perpetual futures Open Interest (OI) averaging 2.4 billion XRP on Monday, up from 2.13 billion XRP the previous day.
Bitcoin Price Forecast: BTC remains below key 50-day EMA as headwinds from escalating US-Iran conflict offset ETF inflows
Bitcoin (BTC) trades just below its 50-day Exponential Moving Average (EMA) near $65,000 on Monday, a key technical level that could determine its next directional move. Institutional demand via ETFs improved somewhat last week, providing some tailwind for the Crypto King, but the latest round of strikes between the US and Iran has dampened risk appetite.
Crypto Today: Bitcoin, Ethereum, XRP slip as US-Iran escalating hostilities pressure risk assets
Cryptocurrency prices remain under pressure on Monday, as Bitcoin (BTC) falls toward $64,000. Altcoins, including Ethereum (ETH) and Ripple (XRP), uphold a weakening technical structure. ETH is trading sideways between support at $1,826 and resistance at $1,937. Meanwhile, XRP hovers below the pivotal $1.10 level, edging lower toward the primary $1.00 support.
Solana Price Forecast: SOL risks further decline amid weak institutional, retail demand
Solana (SOL) price edges lower on Monday, maintaining a corrective tone from early July. Institutional demand remains muted, with two consecutive weeks of inflows under $1 million, while declining Open Interest and the funding rate point to bearish retail interest, even as trading volume rises by over 70% in 24 hours.
Bitcoin’s potential recovery in the second half hinges on these 4 catalysts
Bitcoin (BTC) has fallen over 34% in the first half of this year as the King Crypto failed to capitalize on a good semester for risk assets despite the woes from the Iran war.