Bitcoin (BTC/USD) forecasting the decline after Elliott Wave double three pattern

In this technical article we’re going to take a look at the Elliott Wave charts charts of BTCUSD published in members area of the website. Recently Bitcoin made recovery against the 69097.5 peak that has unfolded as Elliott Wave Double Three Pattern. It made clear 7 swings from the lows and complete at the extreme zone. In further text we’re going to explain the Elliott Wave pattern and forecast
Before we take a look at the real market example, let’s explain Elliott Wave Double Three pattern.
Elliott Wave double three pattern
Double three is the common pattern in the market , also known as 7 swing structure. It’s a reliable pattern which is giving us good trading entries with clearly defined invalidation levels. The picture below presents what Elliott Wave Double Three pattern looks like. It has (W),(X),(Y) labeling and 3,3,3 inner structure, which means all of these 3 legs are corrective sequences. Each (W) and (Y) are made of 3 swings , they’re having A,B,C structure in lower degree, or alternatively they can have W,X,Y labeling.
BTC/USD 4h hour Elliott Wave analysis
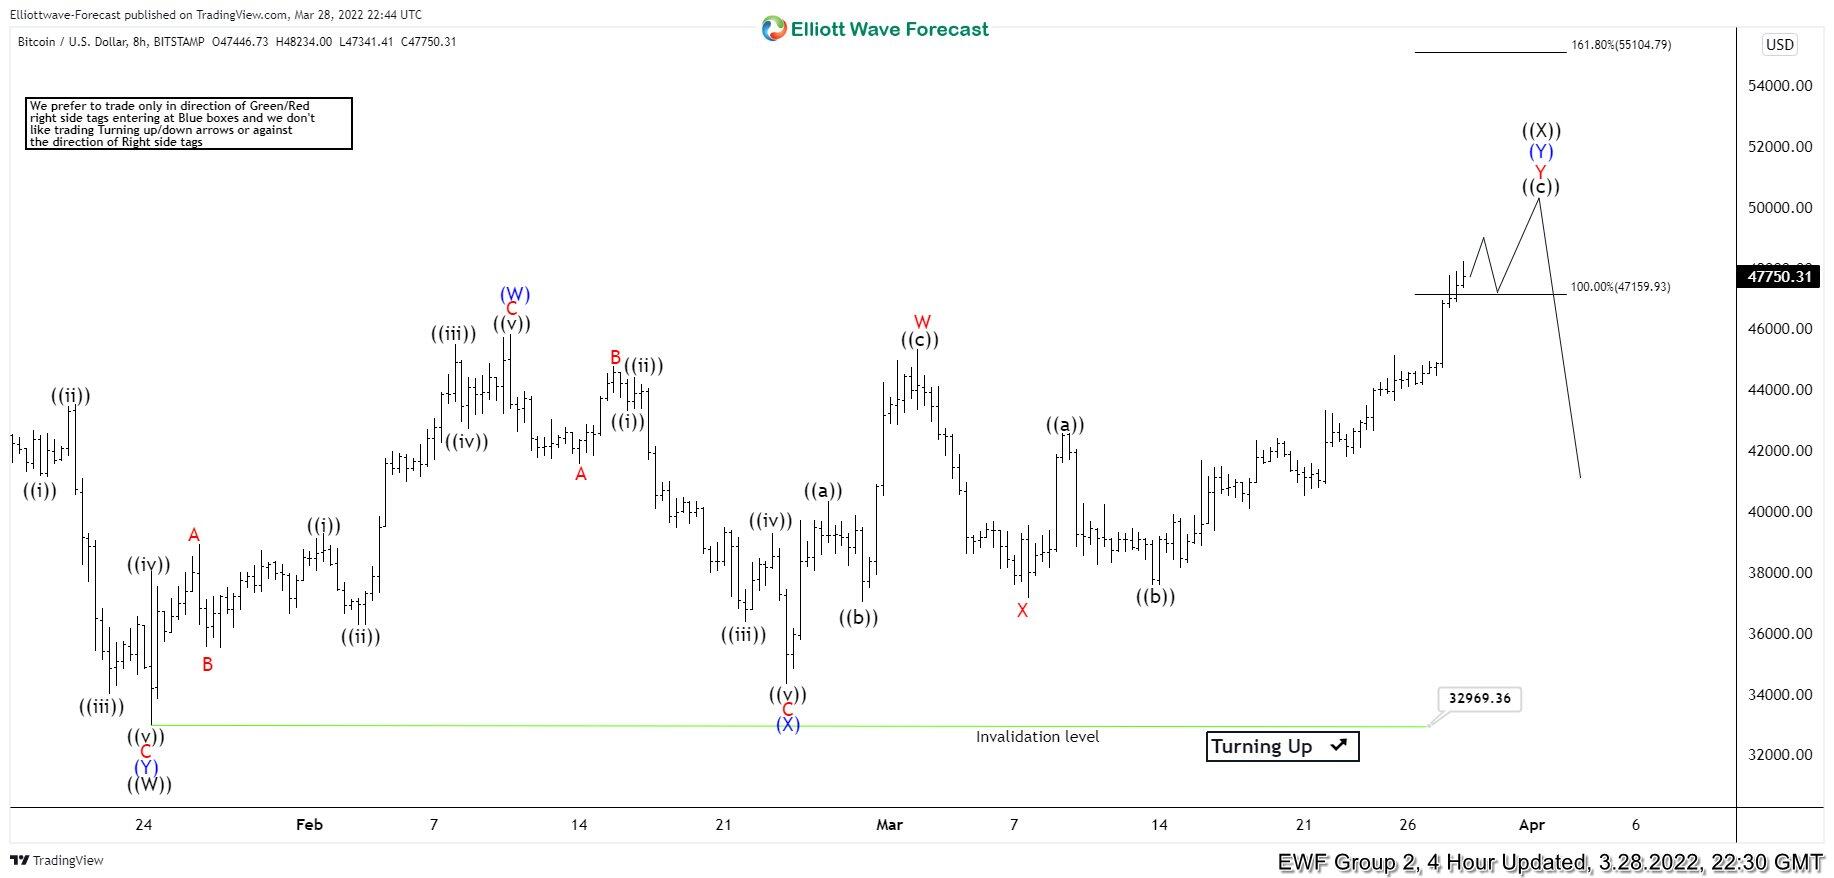
Bitcoin is giving us ((X)) black recovery that is unfolding as Elliott Wave Double Three Pattern, with (X)(X)(Y) blue inner labeling. The price is correcting cycle from the all-time high: 69097.5 . If we take a close look , we can count clear 7 swings up from the 32969.3 low. All 3 waves have corrective subdivisions. Bitcoin has already reached extreme zone from the lows at 47159.9-55104.7. At that zone buyers should be ideally taking profits and sellers can appear again. Consequently , we expect to see reaction from the that area. From there we can get either decline toward new lows or larger 3 waves pull back at least.
BTC/USD 4h hour Elliott Wave analysis
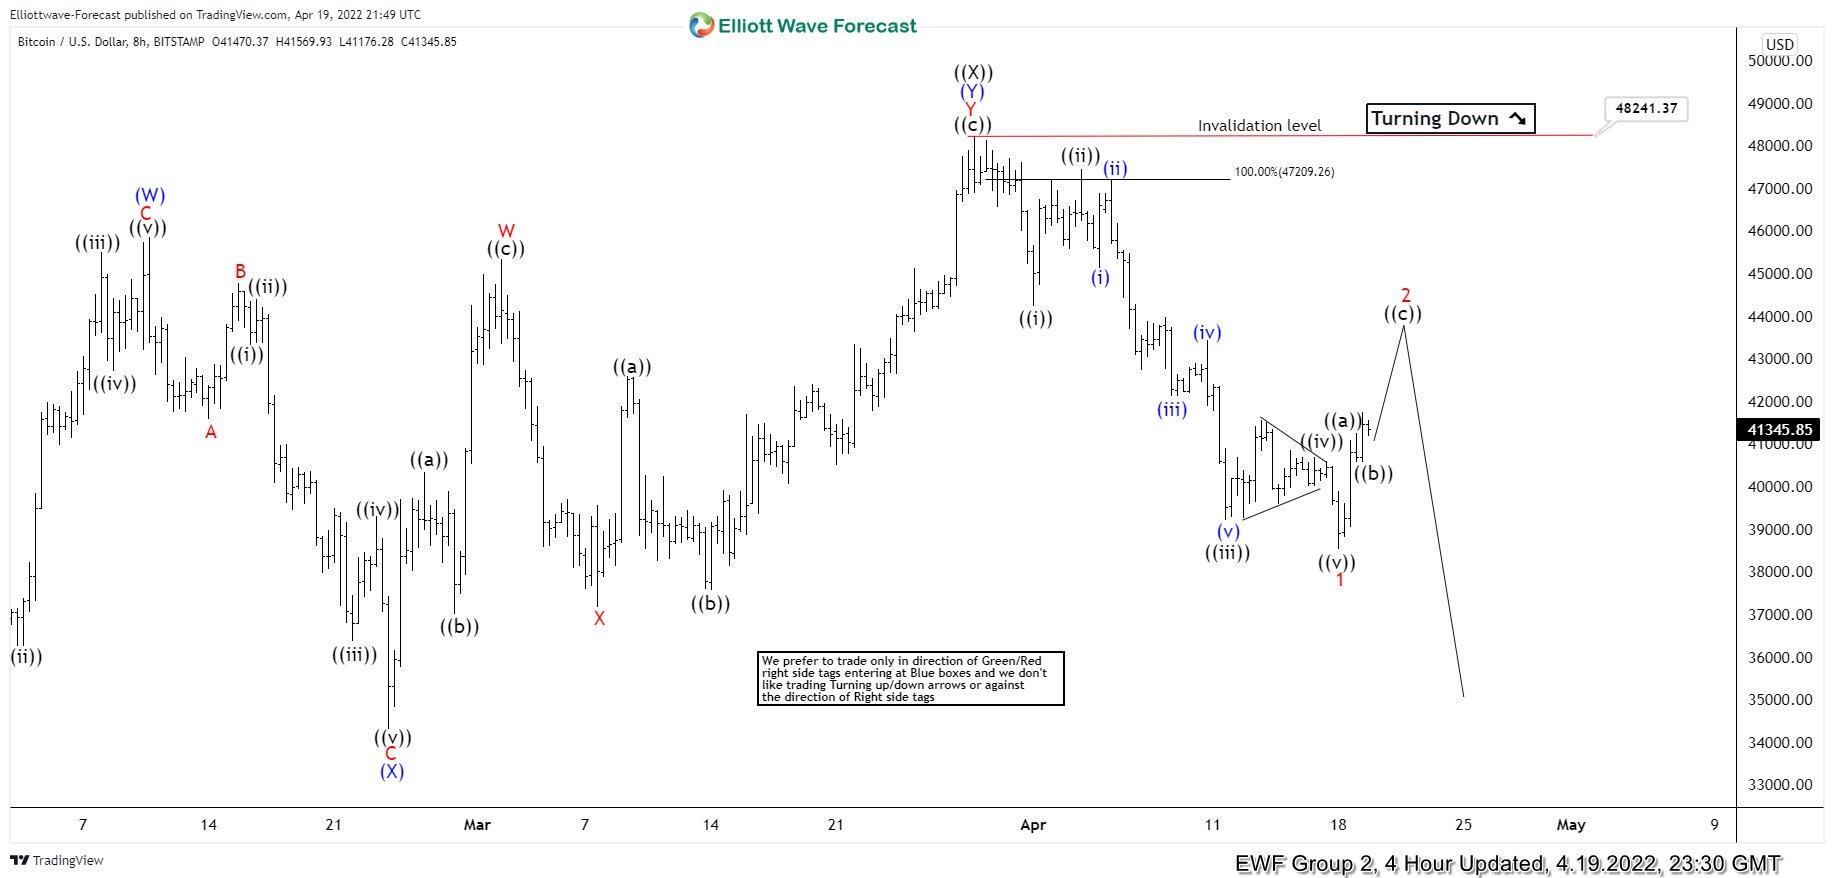
Sellers appeared right at the marked extreme zone : 47159.9-55104.7 and we got good reaction. ((X)) connector completed at 48241.3 high.The decline from that peak has a form of 5 waves- 1 red which increases chances of further extension down once 3 waves bounce in 2 red completes. Wave 2 recovery can see approximately 43460.5-44544.2 area before Bitcoin turns lower again in next leg down. Key pivot for presented short term view comes at 48241.3 high. If that pivot gets broken, it will invalidate the count.
Author

Elliott Wave Forecast Team
ElliottWave-Forecast.com


