Bitcoin (BTC) hit multi-day lows into Aug. 10 as crypto traders braced for impact with fresh United States inflation data. 

Chart

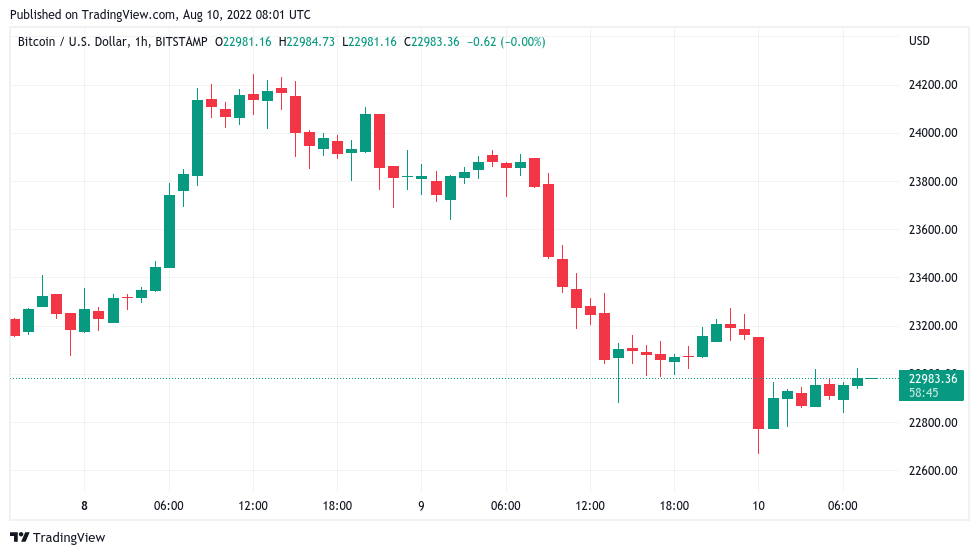
BTC/USD 1-hour candle chart (Bitstamp). Source: TradingView

Trader: Market "could get ugly" if CPI keeps rising

Data from Cointelegraph Markets Pro and TradingView showed BTC/USD dipping to $22,668 on Bitstamp at the most recent daily close — its lowest since Aug. 5.

Bullish momentum had evaporated during the day prior, and the mood among traders was firmly risk-off as markets awaited the latest Consumer Price Index (CPI) readout.

Covering July, the data was due at 8.30am Eastern time Aug. 10, with expectations demanding it show that U.S. inflation had already peaked.

“CPI prints have been pretty pitoval for BTC price action,” Blockware lead insights analyst William Clemente wrote in part of a tweet about the event, adding that CPI would form a “big day” for crypto.

An accompanying chart showed the impact of previous CPI readouts on BTC/USD.

Chart

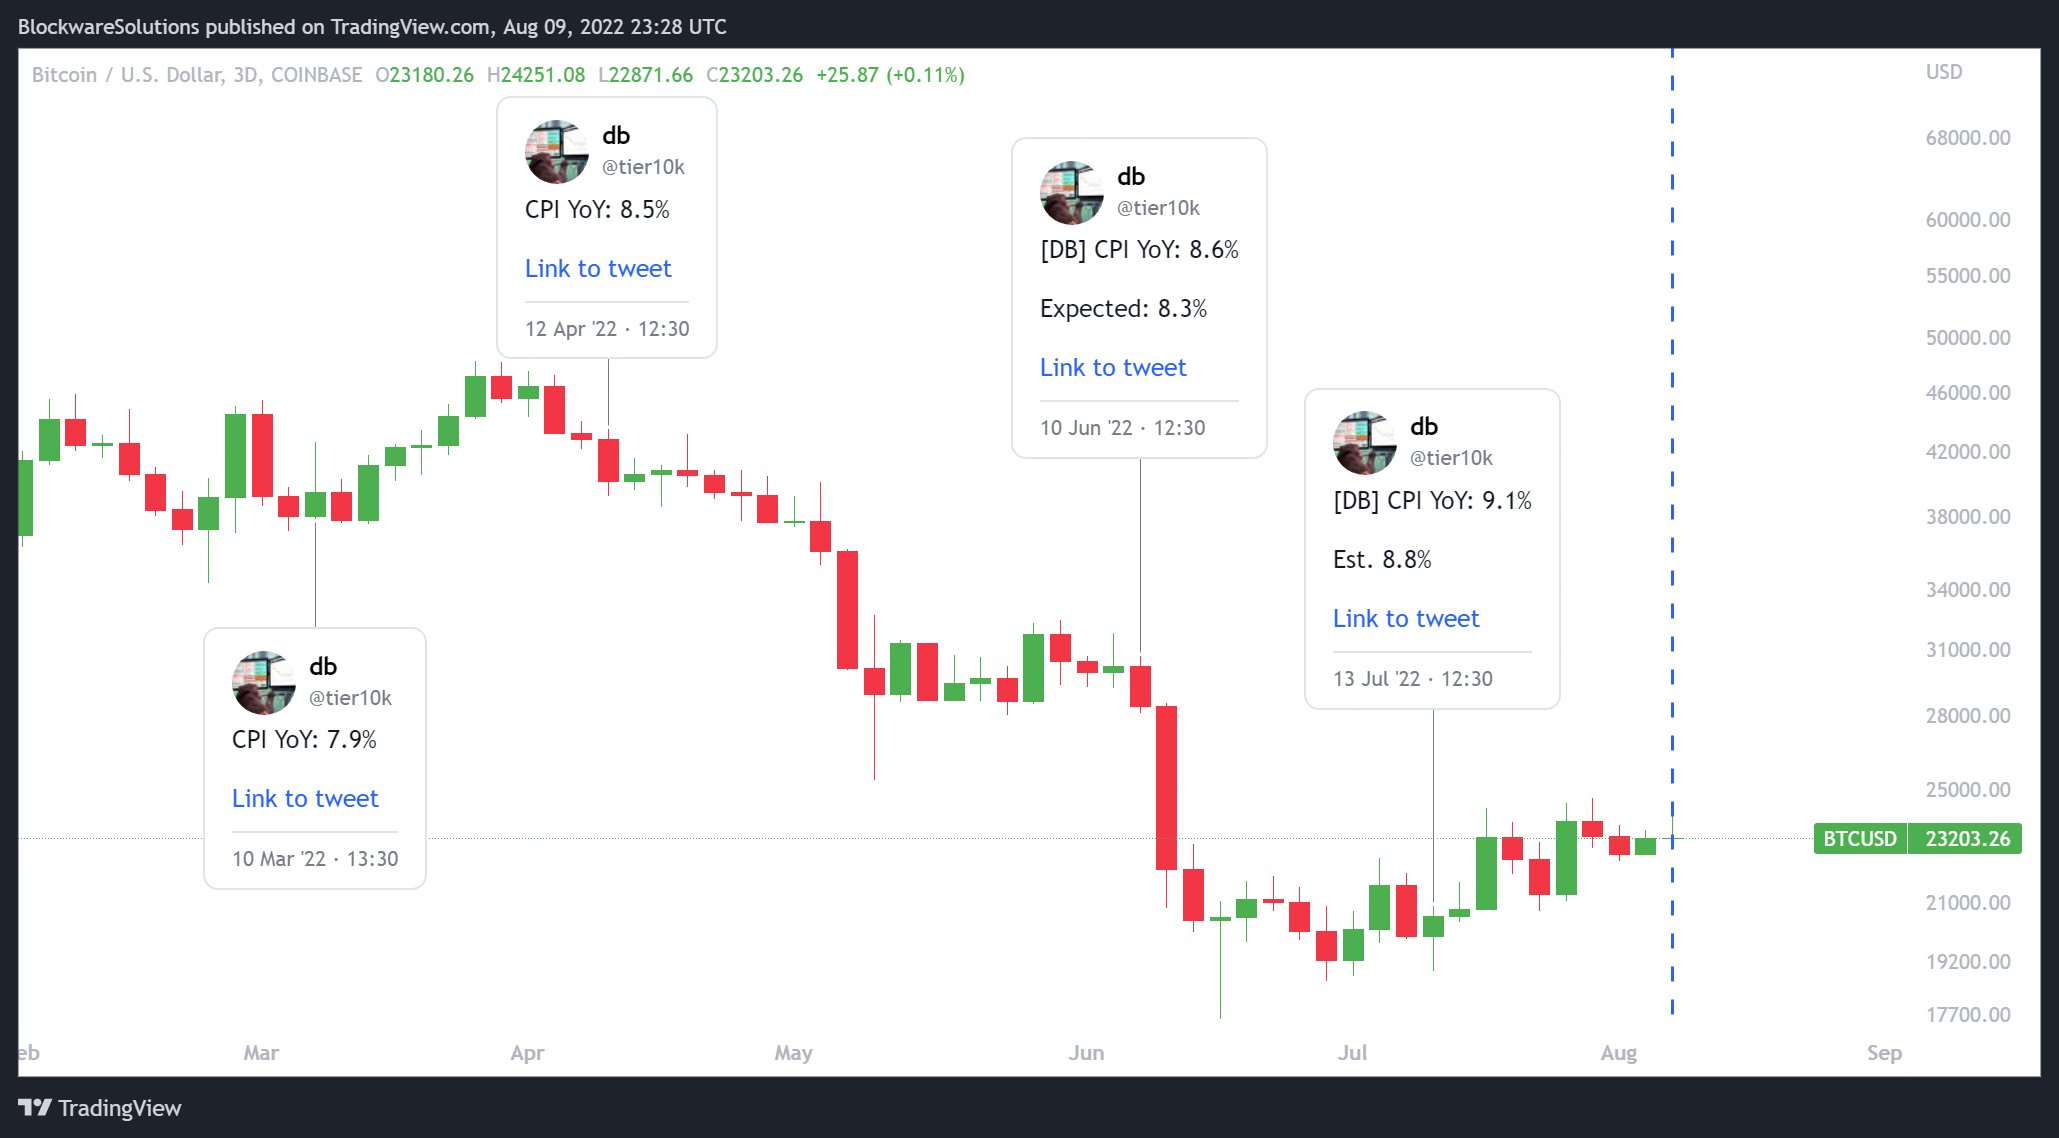
BTC/USD annotated chart showing CPI events. Source: William Clemente/ Twitter

Trader and analyst Daan Crypto Trades meanwhile gave a CPI reading of 9.1 or above as “bearish” for price action against current expectations of 8.7.

“The market has been pumping on the idea of inflation having likely peaked the past month,” he wrote in a dedicated thread.

If it doesn’t get that confirmation today I think it could get ugly short term as the peak will likely be moved forward another 1-2 months. Which likely means a delayed Fed pivot as well.

Macro analyst Alex Krueger was more dismissive, meanwhile, calling CPI a “little number” while acknowledging its impact on risk asset trends.

BTC price still far from bullish pivot zone

BTC price action thus stayed wedged in a familiar range with classic support and resistance levels still in play.

Related: Bitcoin dominance hits 6-month lows as metric proclaims new 'alt season'

BTC/USD circled $23,000 at the time of writing after dropping more than $1,000 the day prior.

Daan Crypto Trades flagged $24,300 as a crucial level to break and hold for Bitcoin to “fly,” with $21,000 a potential target in the event of a breakdown.

On-chain monitoring resource Whalemap meanwhile continued its analysis of whale buy and sell levels.

“$BTC is back to the whale accumulation area,” the Whalemap team summarized on Aug. 9.

Prices where whales accumulate usually act as support or resistance for price action of Bitcoin. Question is, will we get a bounce again or go deeper.

Chart

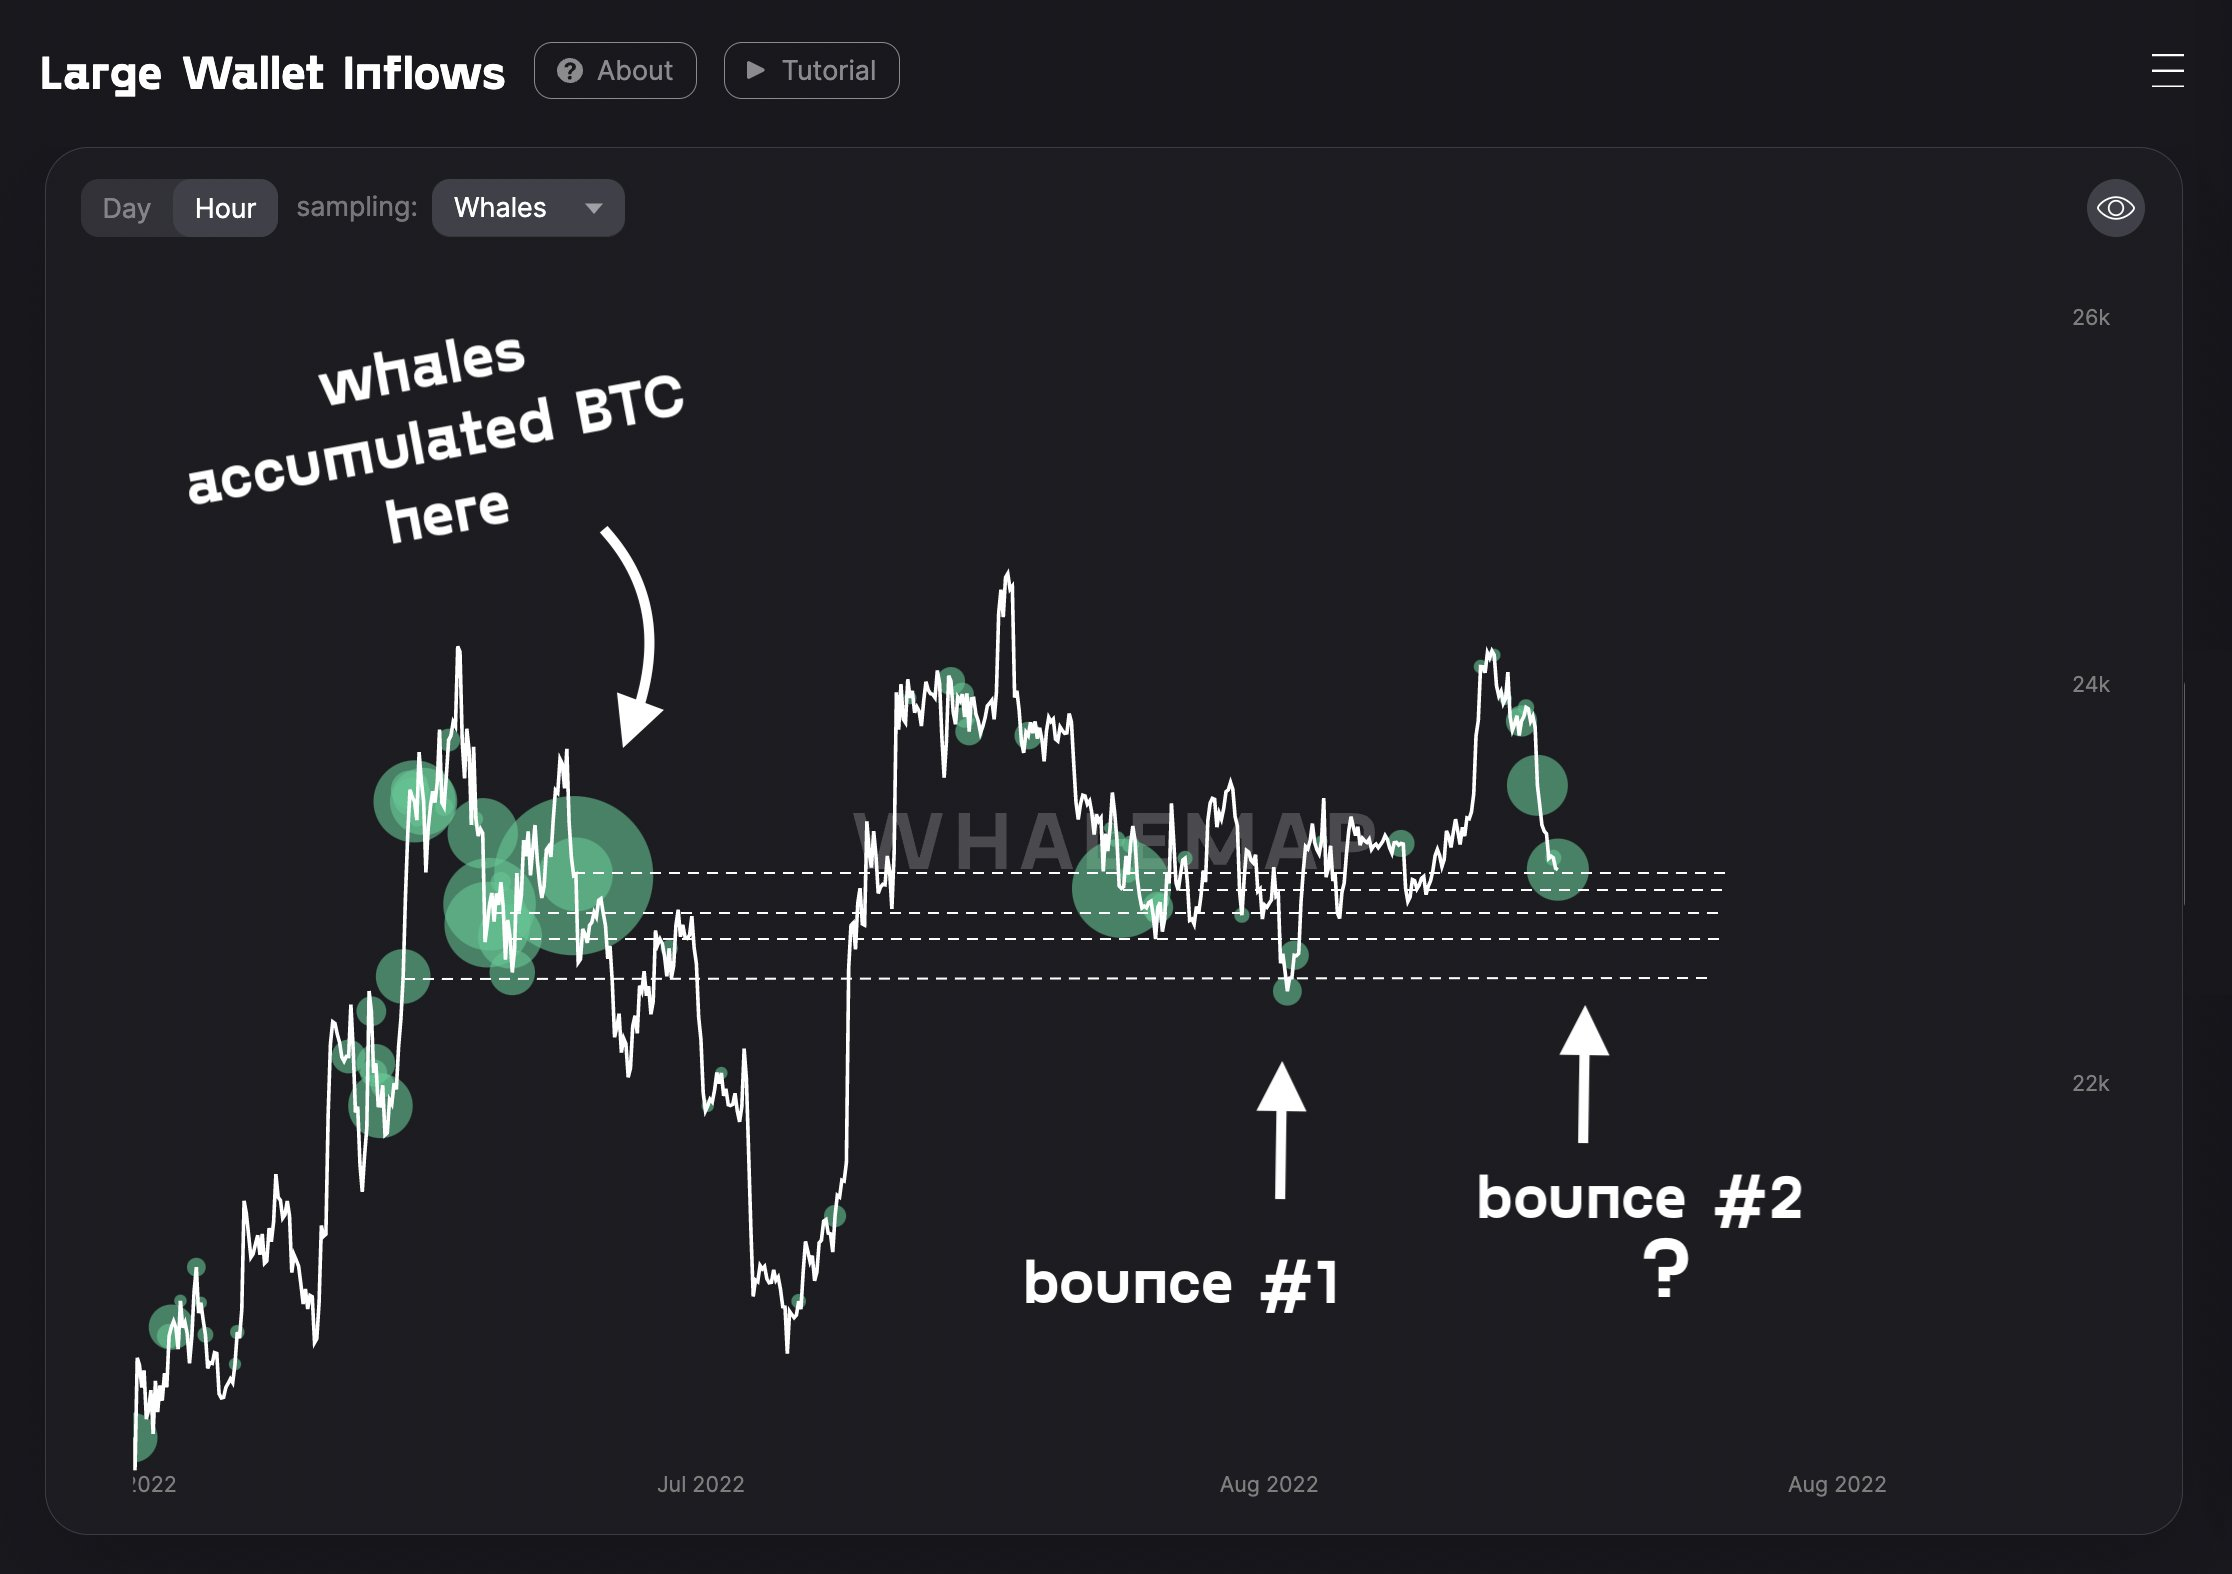
Bitcoin whale wallet inflows annotated chart. Source: Whalemap/ Twitter


Information on these pages contains forward-looking statements that involve risks and uncertainties. Markets and instruments profiled on this page are for informational purposes only and should not in any way come across as a recommendation to buy or sell in these assets. You should do your own thorough research before making any investment decisions. FXStreet does not in any way guarantee that this information is free from mistakes, errors, or material misstatements. It also does not guarantee that this information is of a timely nature. Investing in Open Markets involves a great deal of risk, including the loss of all or a portion of your investment, as well as emotional distress. All risks, losses and costs associated with investing, including total loss of principal, are your responsibility. The views and opinions expressed in this article are those of the authors and do not necessarily reflect the official policy or position of FXStreet nor its advertisers.

Join Telegram

Recommended content


Recommended Content

Editors’ Picks

Ripple wipes out weekly gains, experts comment on role of Ripple stablecoin

Ripple wipes out weekly gains, experts comment on role of Ripple stablecoin

Ripple declined to $0.52 on Thursday, erasing all gains registered earlier this week. Ripple SVP Eric van Miltenburg’s comments on the firm’s stablecoin, and how it is expected to benefit the XRP Ledger and native token XRP have raised concerns among crypto experts. 

More Ripple News

Hedera HBAR slips nearly 10% after air is cleared on mistaken link with giant BlackRock

Hedera HBAR slips nearly 10% after air is cleared on mistaken link with giant BlackRock

HBAR price is down nearly 10% on Thursday, partly erasing gains inspired by the misinterpreted link with BlackRock. Despite the recent correction, Hedera’s price is up 44% in the past seven days.

More Hedera News

The reason behind Bonk’s 105% rise and if you should buy now Premium

The reason behind Bonk’s 105% rise and if you should buy now

Bonk price has shot up 105% in the past five weeks. A retracement into $0.0000216 or the $0.0000152 to $0.0000186 imbalance would be a good buying opportunity. Patient investors can expect double-digit gains from BONK that could extend up to 70%.

More Cryptocurrencies News

Injective price weakness persists despite over 5.9 million INJ tokens burned

Injective price weakness persists despite over 5.9 million INJ tokens burned

Injective price is trading with a bearish bias, stuck in the lower section of the market range. The bearish outlook abounds despite the network's deflationary efforts to pump the price. Coupled with broader market gloom, INJ token’s doomed days may not be over yet.

More Injective News

Bitcoin: BTC post-halving rally could be partially priced in Premium

Bitcoin: BTC post-halving rally could be partially priced in

Bitcoin (BTC) price briefly slipped below the $60,000 level for the last three days, attracting buyers in this area as the fourth BTC halving is due in a few hours. Is the halving priced in for Bitcoin? Or will the pioneer crypto note more gains in the coming days? 

Read full analysis

BTC

ETH

XRP