Bitcoin: big Market Shift Dead Ahead

In financial markets, it’s rarely possible to know, in advance, precisely when a major event will impact supply and demand — let alone how or where.
But in one particular asset and one particular point in time, it does happen.
I’m talking about …
The Bitcoin halving — the immediate, inevitable and irreversible 50% reduction of new Bitcoin supply that is firmly slated for May of this year.
At regular intervals, currently about every four years, the rate at which new BTC coins are created gets cut in half.
The goal is to gradually shrink new coin creation down to zero — which will occur as the total number of BTC in circulation hits its cap of 21 million.
So, here’s how that works …
New Bitcoinsare created to reward miners for their work in validating new transactions and adding them to the Bitcoin ledger.
When Bitcoin was brand-new, miners earned a reward of 50 BTC for every new block they wrote to the blockchain. But ...
- In November 2012, that number was cut by half,to 25 BTC.
- In July 2016, it was halved again — to 12.50 BTC.
- And starting this coming May, it will drop to 6.25 BTC.
This is the “halving” of Bitcoin. And as you can see, it happens approximately every four years.
But here’s the key: In both historical cases, the halving occurred just as Bitcoin was recovering from a prior bear market.
- The 2012 Bitcoin halving followed a prior bear-market low (November 2011) by 12 months.
- The 2016 halving Bitcoin followed the prior bear market's double-bottom (January and August 2015) by 19 months and 11months, respectively.
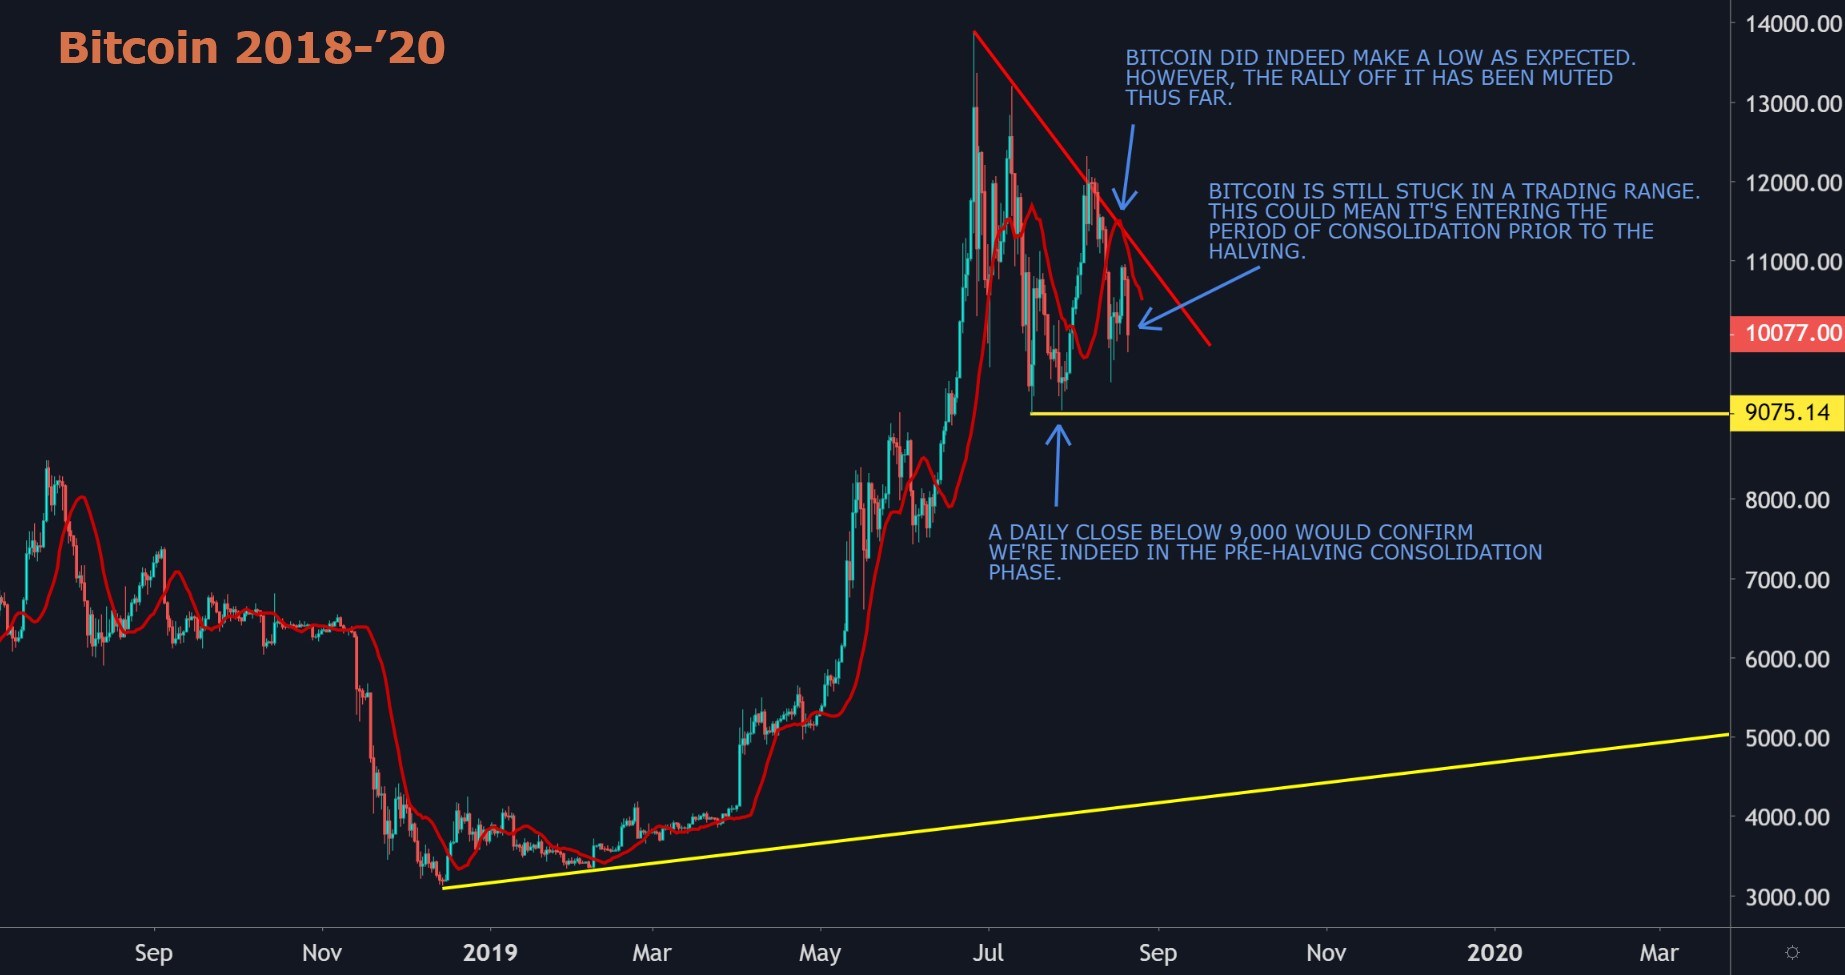
- Next year's halving is due 18 months after Bitcoin's December 2018 bear-market low.
Given our in-depth study of Bitcoin cycles, this aspect merits a closer look. Broadly speaking …
After the first major leg up of a new bull market, Bitcoin often drifts into a relatively sleepy, sometimes months-long interval of sideways trading. Then comes a halving event — after which, the bull market really catches fire.
Now, let's take a look at how the price action surrounding Bitcoin's historical halvingevents traces this pattern.
The Bitcoin Halving of 2012
Here’s exactly what happened in the 12-month period prior to the halving …
- In the first four months of that 12-month period, Bitcoin climbed a robust1.29%per day (on average), as it rebounded from its prior bear-market low.
- However, in the eightmonths immediately prior to the halving, Bitcoin fell into a sideways trading range, during which it managed to climb by an average of just 0.62% a day.
Then, AFTER the halving, Bitcoin shot up a whopping 23% a day (on average) — until it finally reached its bull-market high.
Bitcoin Takes off Like a Rocket After Halving of 2012
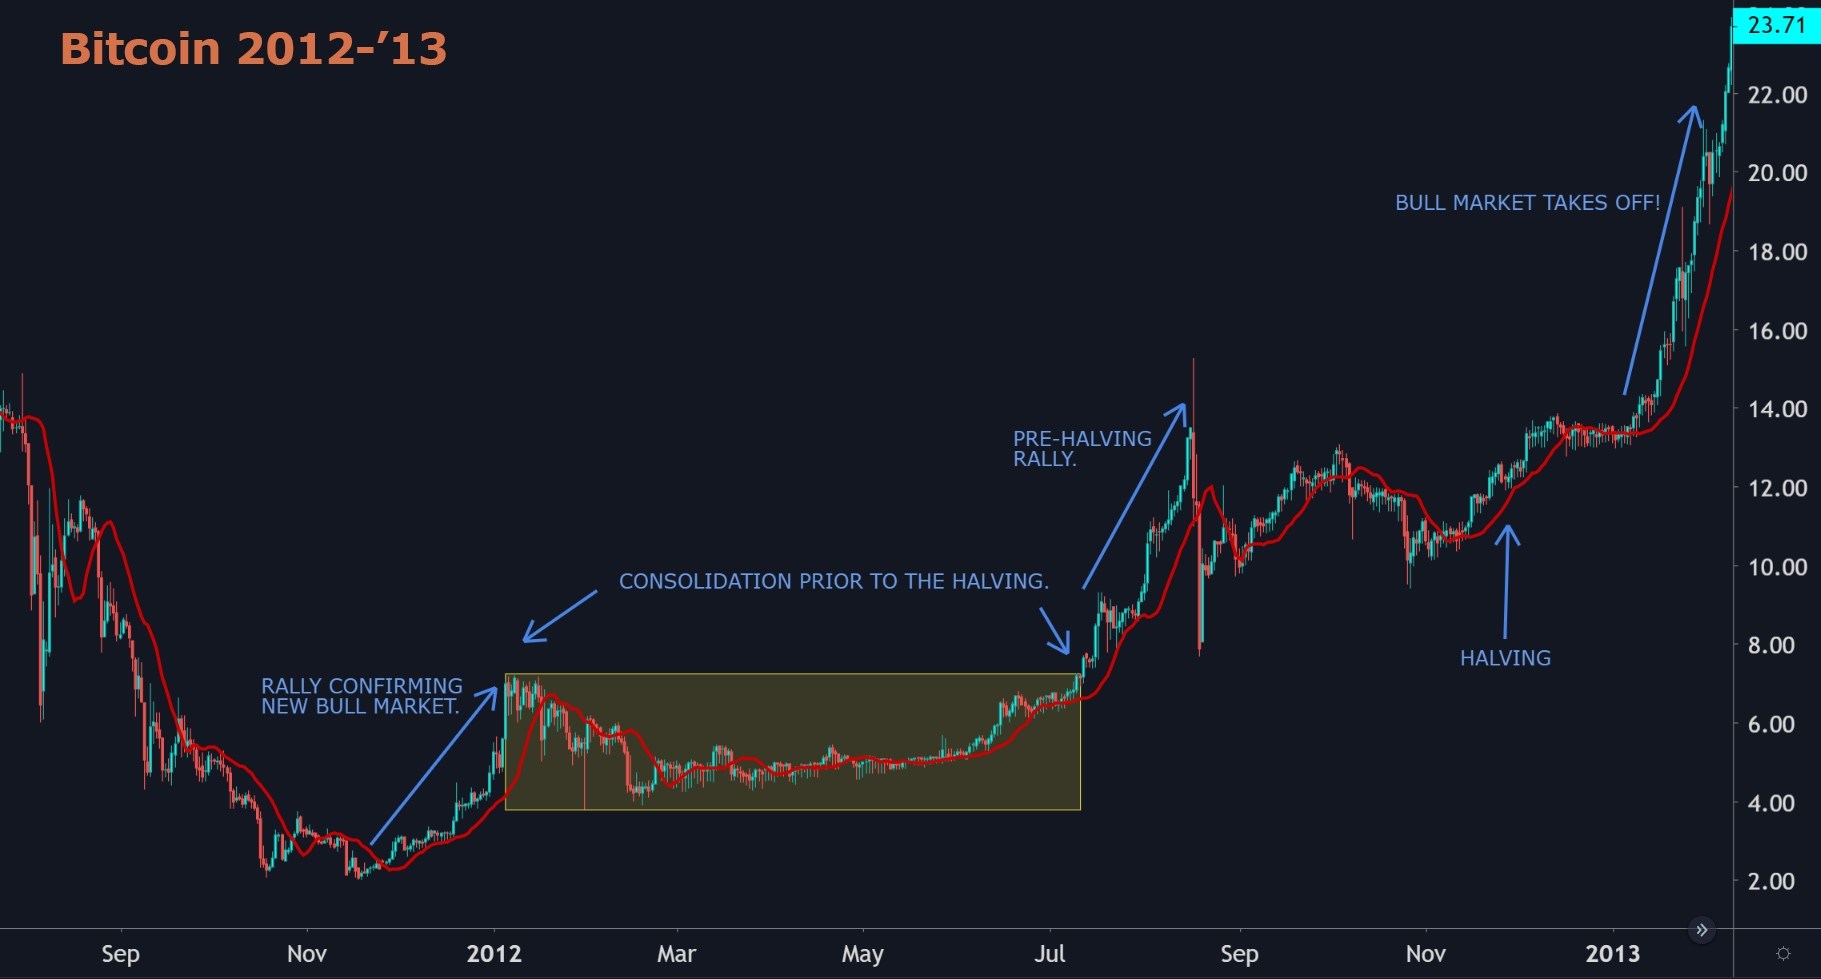
In the chart above, reading from left to right …
-
The first blue arrow points to Bitcoin's initial leg up, as it rebounded from its previous bear-market low.
-
The shaded rectangle points to the sleepy, pre-halving consolidation period that followed.
-
After that period, the next blue arrow points to a spirited rally in anticipation of the halving, followed by a brief return to sideways trading.
-
Finally, as you can see in the chart, it’s only after halving that the 2012 bull market really blastsoff.
The Bitcoin Halving of 2016
Here’s what happened in the 12-month period prior to the 2016 halving. As you will see, the pattern mimics the 2012 experience.
- In the first four months of that 12-month period, Bitcoin climbed by an average 0.84% per day, as it emerged from its prior bear-market low.
- Then, in the eight months immediately prior to the halving, Bitcoin again fell into a sideways trading range, during which it managed to climb by an average of only 0.39% per day.
And AGAIN, after the halving, the Bitcoin bull market abruptly caught a second wind. Bitcoin powered up by an average of 5.41% per day.
Bitcoin Surges to All-TimeHighs After Halving of 2016
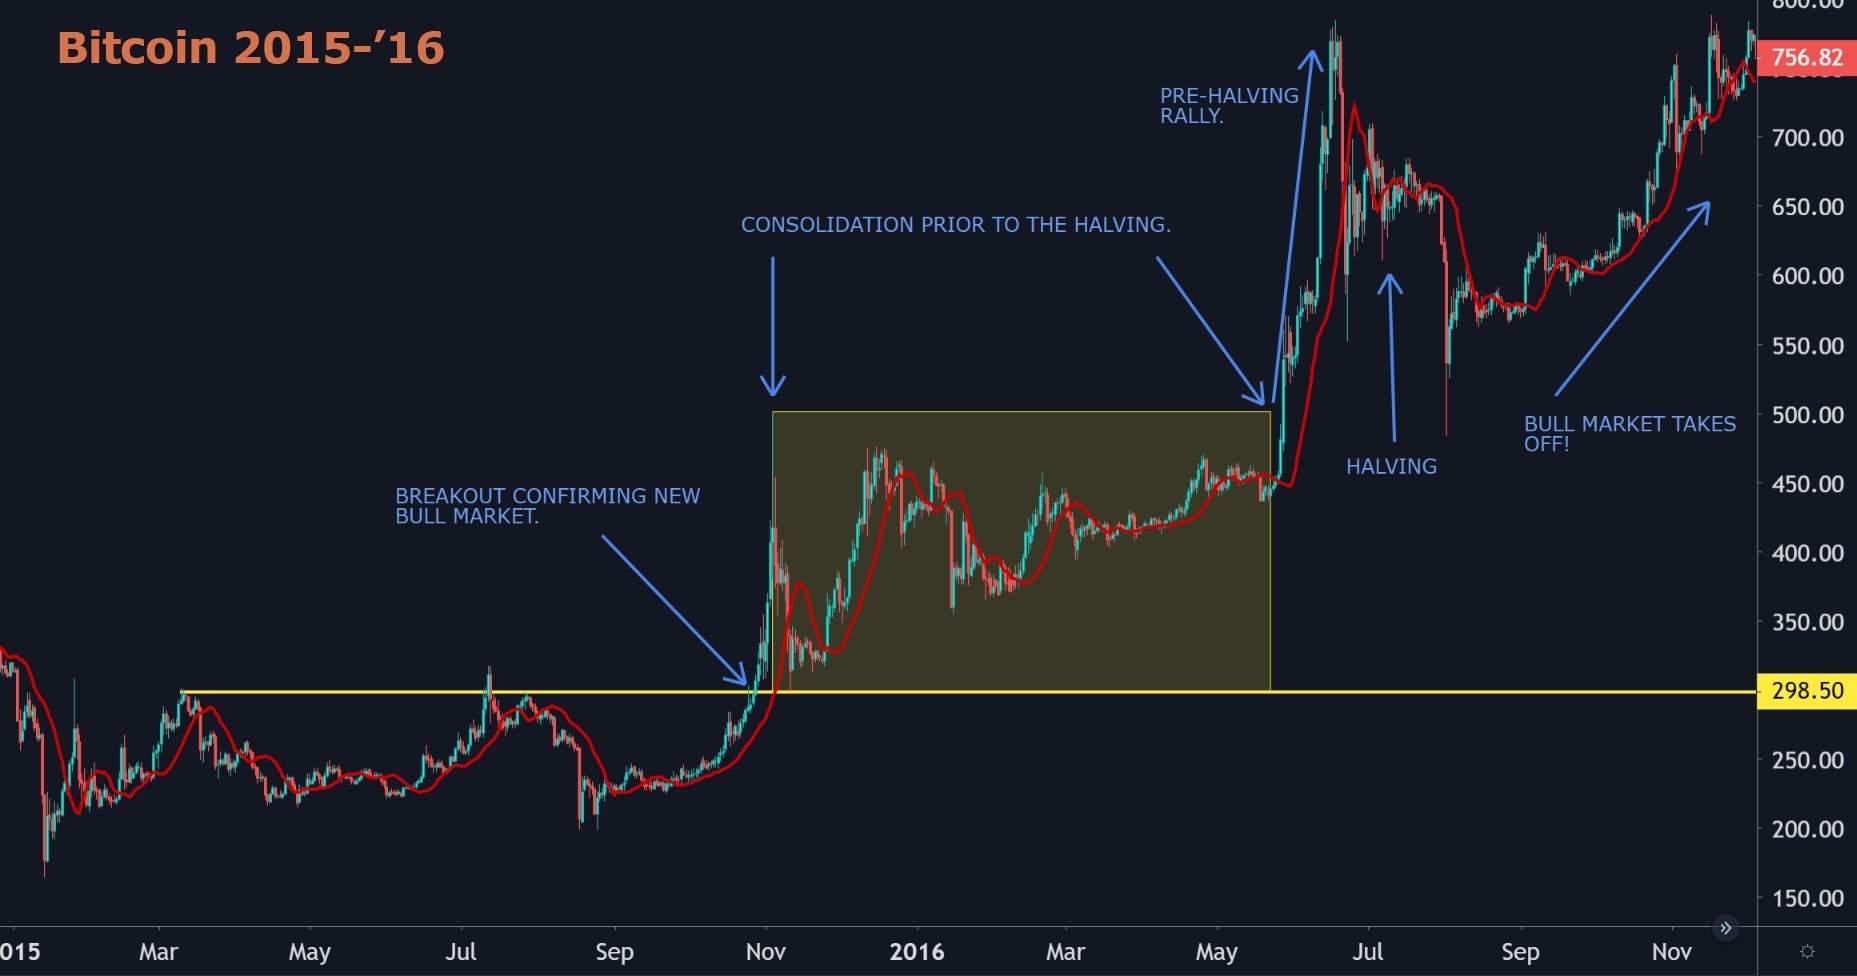
This second chart illustrates how the pattern is similar in the second halving, which occurred in July 2016. Reading the chart from left to right …
-
The first blue arrow shows Bitcoin's first major leg up, as it recovered from its previous bear-market low.
-
Again, the shaded rectangle demarcates the sleepy pre-halving consolidation period that ensued.
-
After that period, the next blue arrow points to a rally in anticipation of the event. In this case, the pre-halving rally is especially exuberant. So, it’s followed by a setback.
-
But again, in the months that follow, Bitcoin explodes in price, ultimately reaching its all-time high in December 2017.
In both cases, a breakout into a new bull market is followed by a pre-halving consolidation. And in both cases, the post-halving portion of the bull market is the strongestof the entire cycle.
Now the big question is: Will this pattern repeat itself in 2020 and beyond? Will the halving coming this May mark the beginning of another spectacular rise in Bitcoin? And what would be the best strategy for profiting from that move?
Stay tuned for the answers. Before you invest, there are critical wrinkles and risks you will need to be aware of.
Always remember: Although the past pattern is clear, history has a sneaky habit of adding some new twists and turns.
Author

Juan Villaverde
Weiss Crypto Ratings
Juan Villaverde is an econometrician and mathematician devoted to the analysis of cryptocurrencies since 2012.


