|

BCH/USD technical analysis: Bitcoin Cash bulls win the fight for the 200.00 level

  • During Wednesday's price crash the price just dipped below 200.00
  • Today the RSI has turned up as the bulls have come back to push the price higher.

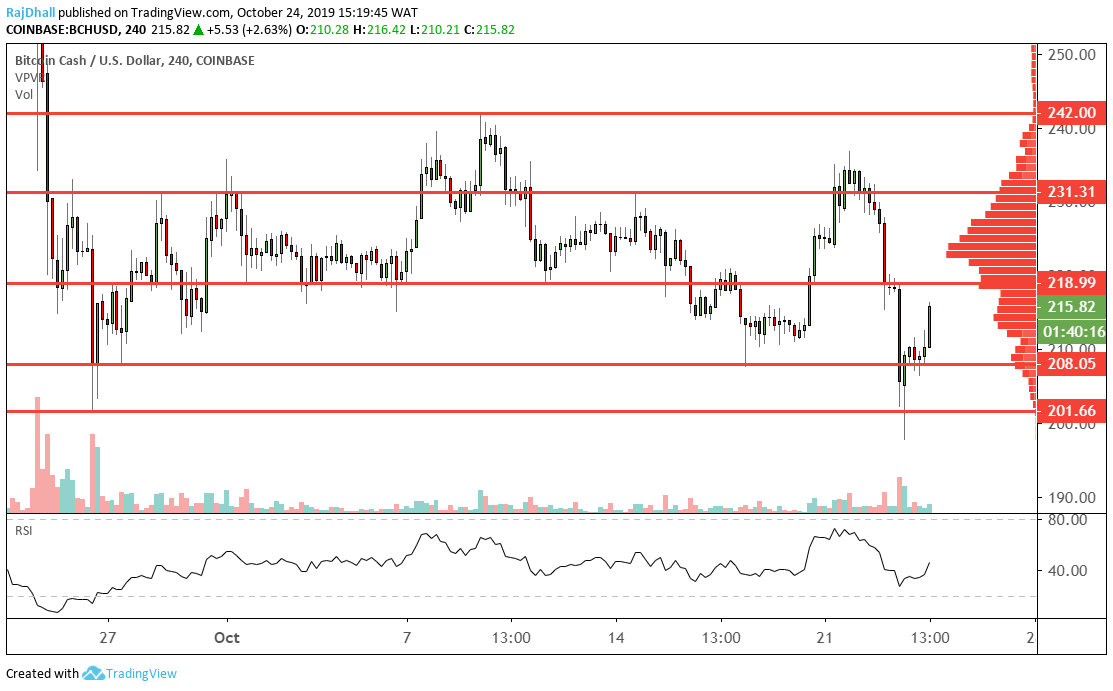
Bitcoin Cash trades 2.63% higher today after crashing below the psychological 200.00 level during Wednesday's crypto market crash.

The level is quite a significant one and it does count as being broken as the price printed below, but the bulls were not ready to give up.

The overall trend is still lower but it is a gallant effort and the 218.99 resistance level looks like a firm one. 

The RSI indicator has ticked up and I will be watching carefully what happens at the 50 mid-point.

On the daily chart, there was a resistance point at 200.00 on 21st December 2018. This shows how important historical levels are in technical analysis. 

The four-hour chart below is more of a short term view and it clearly confirms the mass volume is on the sell-side.
Bitcoin Cash Analysis

BCH/USD

Overview
Today last price 215.9712
Today Daily Change 5.7240
Today Daily Change %2.72
Today daily open210.2472
 
Trends
Daily SMA20223.5608
Daily SMA50257.8995
Daily SMA100285.4496
Daily SMA200325.2474
 
Levels
Previous Daily High227.7627
Previous Daily Low197.9382
Previous Weekly High230.9302
Previous Weekly Low207.7218
Previous Monthly High333.7339
Previous Monthly Low202.6094
Daily Fibonacci 38.2%209.3312
Daily Fibonacci 61.8%216.3697
Daily Pivot Point S1196.2027
Daily Pivot Point S2182.1582
Daily Pivot Point S3166.3782
Daily Pivot Point R1226.0272
Daily Pivot Point R2241.8072
Daily Pivot Point R3255.8517

Author

Rajan Dhall, MSTA

Rajan Dhall is an experienced market analyst, who has been trading professionally since 2007 managing various funds producing exceptional returns.


More from Rajan Dhall, MSTA
Share:

Editor's Picks

XRP recovery may stall above support as weak on-chain metrics reinforce bearish outlook

Ripple (XRP) shows subtle signs of recovery above $1.05 on Tuesday, with the move to around $1.07 ending three straight days of losses amid a pressured broader cryptocurrency market.

Crypto Today: Bitcoin, Ethereum, XRP extend sideways trading amid ETF outflows, US-Iran war escalation

Bitcoin hovers around $62,500 amid prevalent sideways trading. Meanwhile, major altcoins such as Ethereum and Ripple are holding above crucial support levels at $1,700 and $1.05, respectively, reflecting ongoing consolidation across the crypto sector.

Curve DAO tests breakout rally as bulls target over 15% upside

Curve DAO price is up 4% on Tuesday, extending its 3% gains from the previous day to emerge as the best-performing altcoin over the last 24 hours. On-chain data shows waning selling pressure as supply available on exchanges declines, while top holders increase their exposure amid rising supply in profit.

Bitcoin Price Forecast: Geopolitical tensions, ETF outflows keep BTC under pressure 

Bitcoin remains under pressure, trading at $62,600 on Tuesday after slipping over 2% in the previous day. The bearish bias is further fueled by renewed geopolitical tensions between the US and Iran, which have dampened risk appetite.

Bitcoin: Strategy sells, the market doesn’t care
Bitcoin (BTC) reclaims $64,000 on Friday, extending a modest recovery while holding firmly above the key technical support zone so far this week. Mixed spot Exchange Traded Funds (ETFs) flows through Thursday reflect cautious institutional positioning. Meanwhile, traders have digested headlines about Strategy’s recent Bitcoin sale, highlighting the Crypto King’s resilience and deep liquidity.


