Band Protocol Price Forecast: BAND poised for a 30% rally
- Band Protocol price breakout getting volume commitment from traders.
- Daily Relative Strength Index (RSI) is no longer overbought.
- Short-term moving averages have been a price magnet through March.

Band Protocol price has traded sideways in a clear channel in March. Today’s heavy buying is lifting the token from the consolidation on the strongest 12-hour candlestick since the February high.
Band Protocol price compression leads to price expansion
After examining the BAND weekly chart, it quickly becomes evident that the price rarely closes at the weekly high. It should be an essential consideration if the breakout gains momentum this week and approaches the all-time high at $20.78.
For example, during the week of February 8, BAND printed a weekly high of $20.78 but closed at $16.88. Similarly, the following week it reached $20.72 before closing at $17.00.
Many key resistance levels will need to be overcome before a test of the all-time high. First, the merging of the 0.618 Fibonacci retracement level at $16.92 with the highest weekly close at $17.00. The next dominant level combines the 0.786 retracement level at $18.61 with the high of the February 22 week at $18.84.
If those levels are overcome, BAND should rush to the $20.00 level, representing a gain of 30% from the channel breakout.
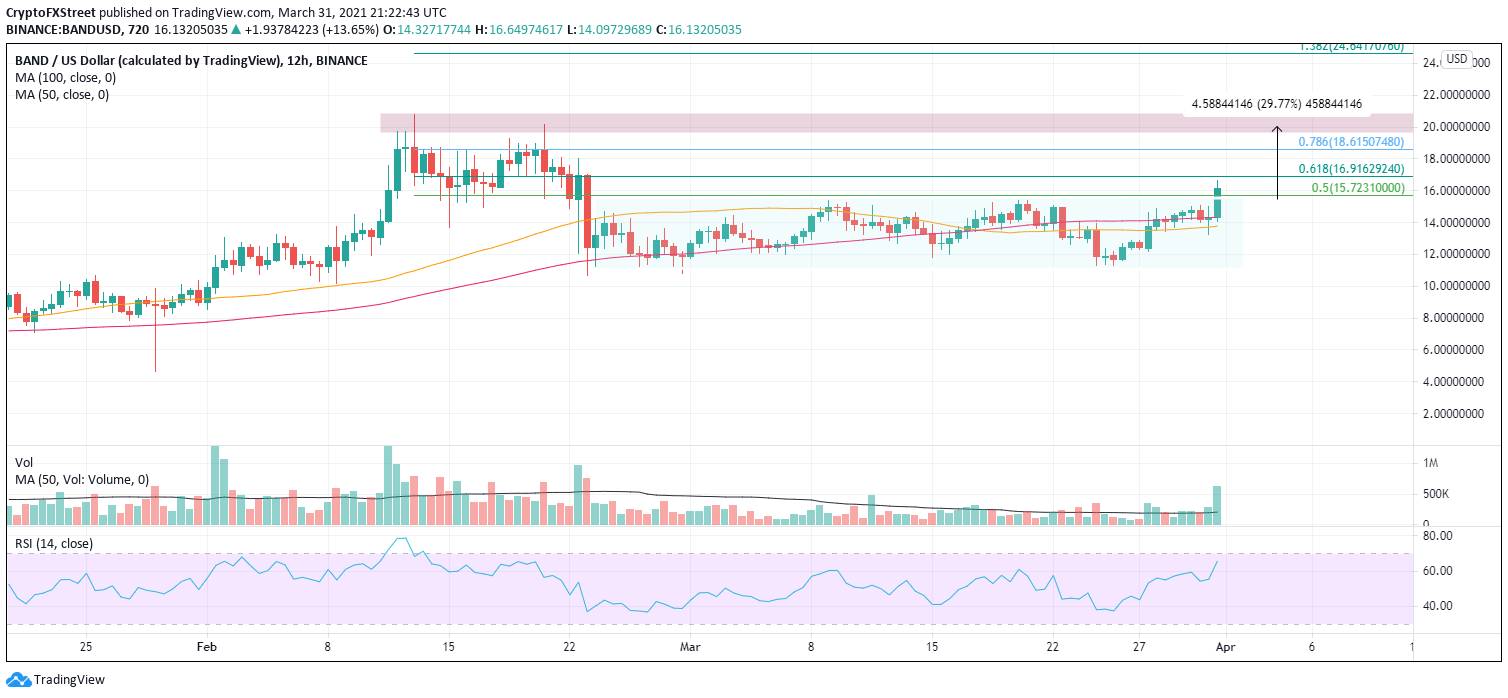
BAND/USD 12-hour chart
Downside risk levels include the price range between the 50 twelve-hour simple moving average (SMA) and the 100 twelve-hour SMA around $14.00. The next considerable support does not appear until the lows of the channel, around $11.20.
Author

Sheldon McIntyre, CMT
Independent Analyst
Sheldon has 24 years of investment experience holding various positions in companies based in the United States and Chile. His core competencies include BRIC and G-10 equity markets, swing and position trading and technical analysis.


