Arbitrum Price Forecast: ARB likely to crash 11% next week
- Arbitrum price eyes a pullback after a 30% rally.
- An 11% correction to sweep the liquidity resting below $0.981 seems likely for ARB.
- A four-hour candlestick close that flips the $1.14 hurdle into the support floor will invalidate the bearish thesis.
Arbitrum price seems to be exhausted after a recent recovery rally, hinting at a potential correction. The pullback could allow ARB bulls to take a breather while short-term investors book profits.
Also read: Arbitrum boosts Layer 3 network development as Polygon, BNB Chain lag behind
Arbitrum price ready to shed some weight
Arbitrum price rallied 30% between June 15 and 21 and set up a local top at $1.174. After this point, ARB bulls seem to have taken a break, which has led to a slow correction that has produced three lower highs.
The latest lower high was set at $1.138, and Arbitrum price looks ready to slide down a minimum of 8% and tag the immediate support level at $1.017 support level. In some cases, ARB bears could drive the altcoin as low as $0.981 in search of sell-side liquidity resting below the equal lows formed between June 17 and 20.
Further adding credence to this downswing is the Relative Strength Index (RSI), which has been producing lower lows and currently attempting to stay above the mean level of 50. A failure to do so will signal a takeover by bears and will further add wind to the sails of short-sellers. Likewise, the Awesome Oscillator (AO) also depicts a bearish resurgence as the histograms have declined in magnitude and hint at a transition to sub-zero levels. A successful flip would indicate the dominance of bearish momentum.
Lastly, the Wave Trend indicator also produced a sell-signal on June 22 and continues to decline, indicating that it is time for a correction. In total, this move would constitute an 11.37% move for Arbitrum price.
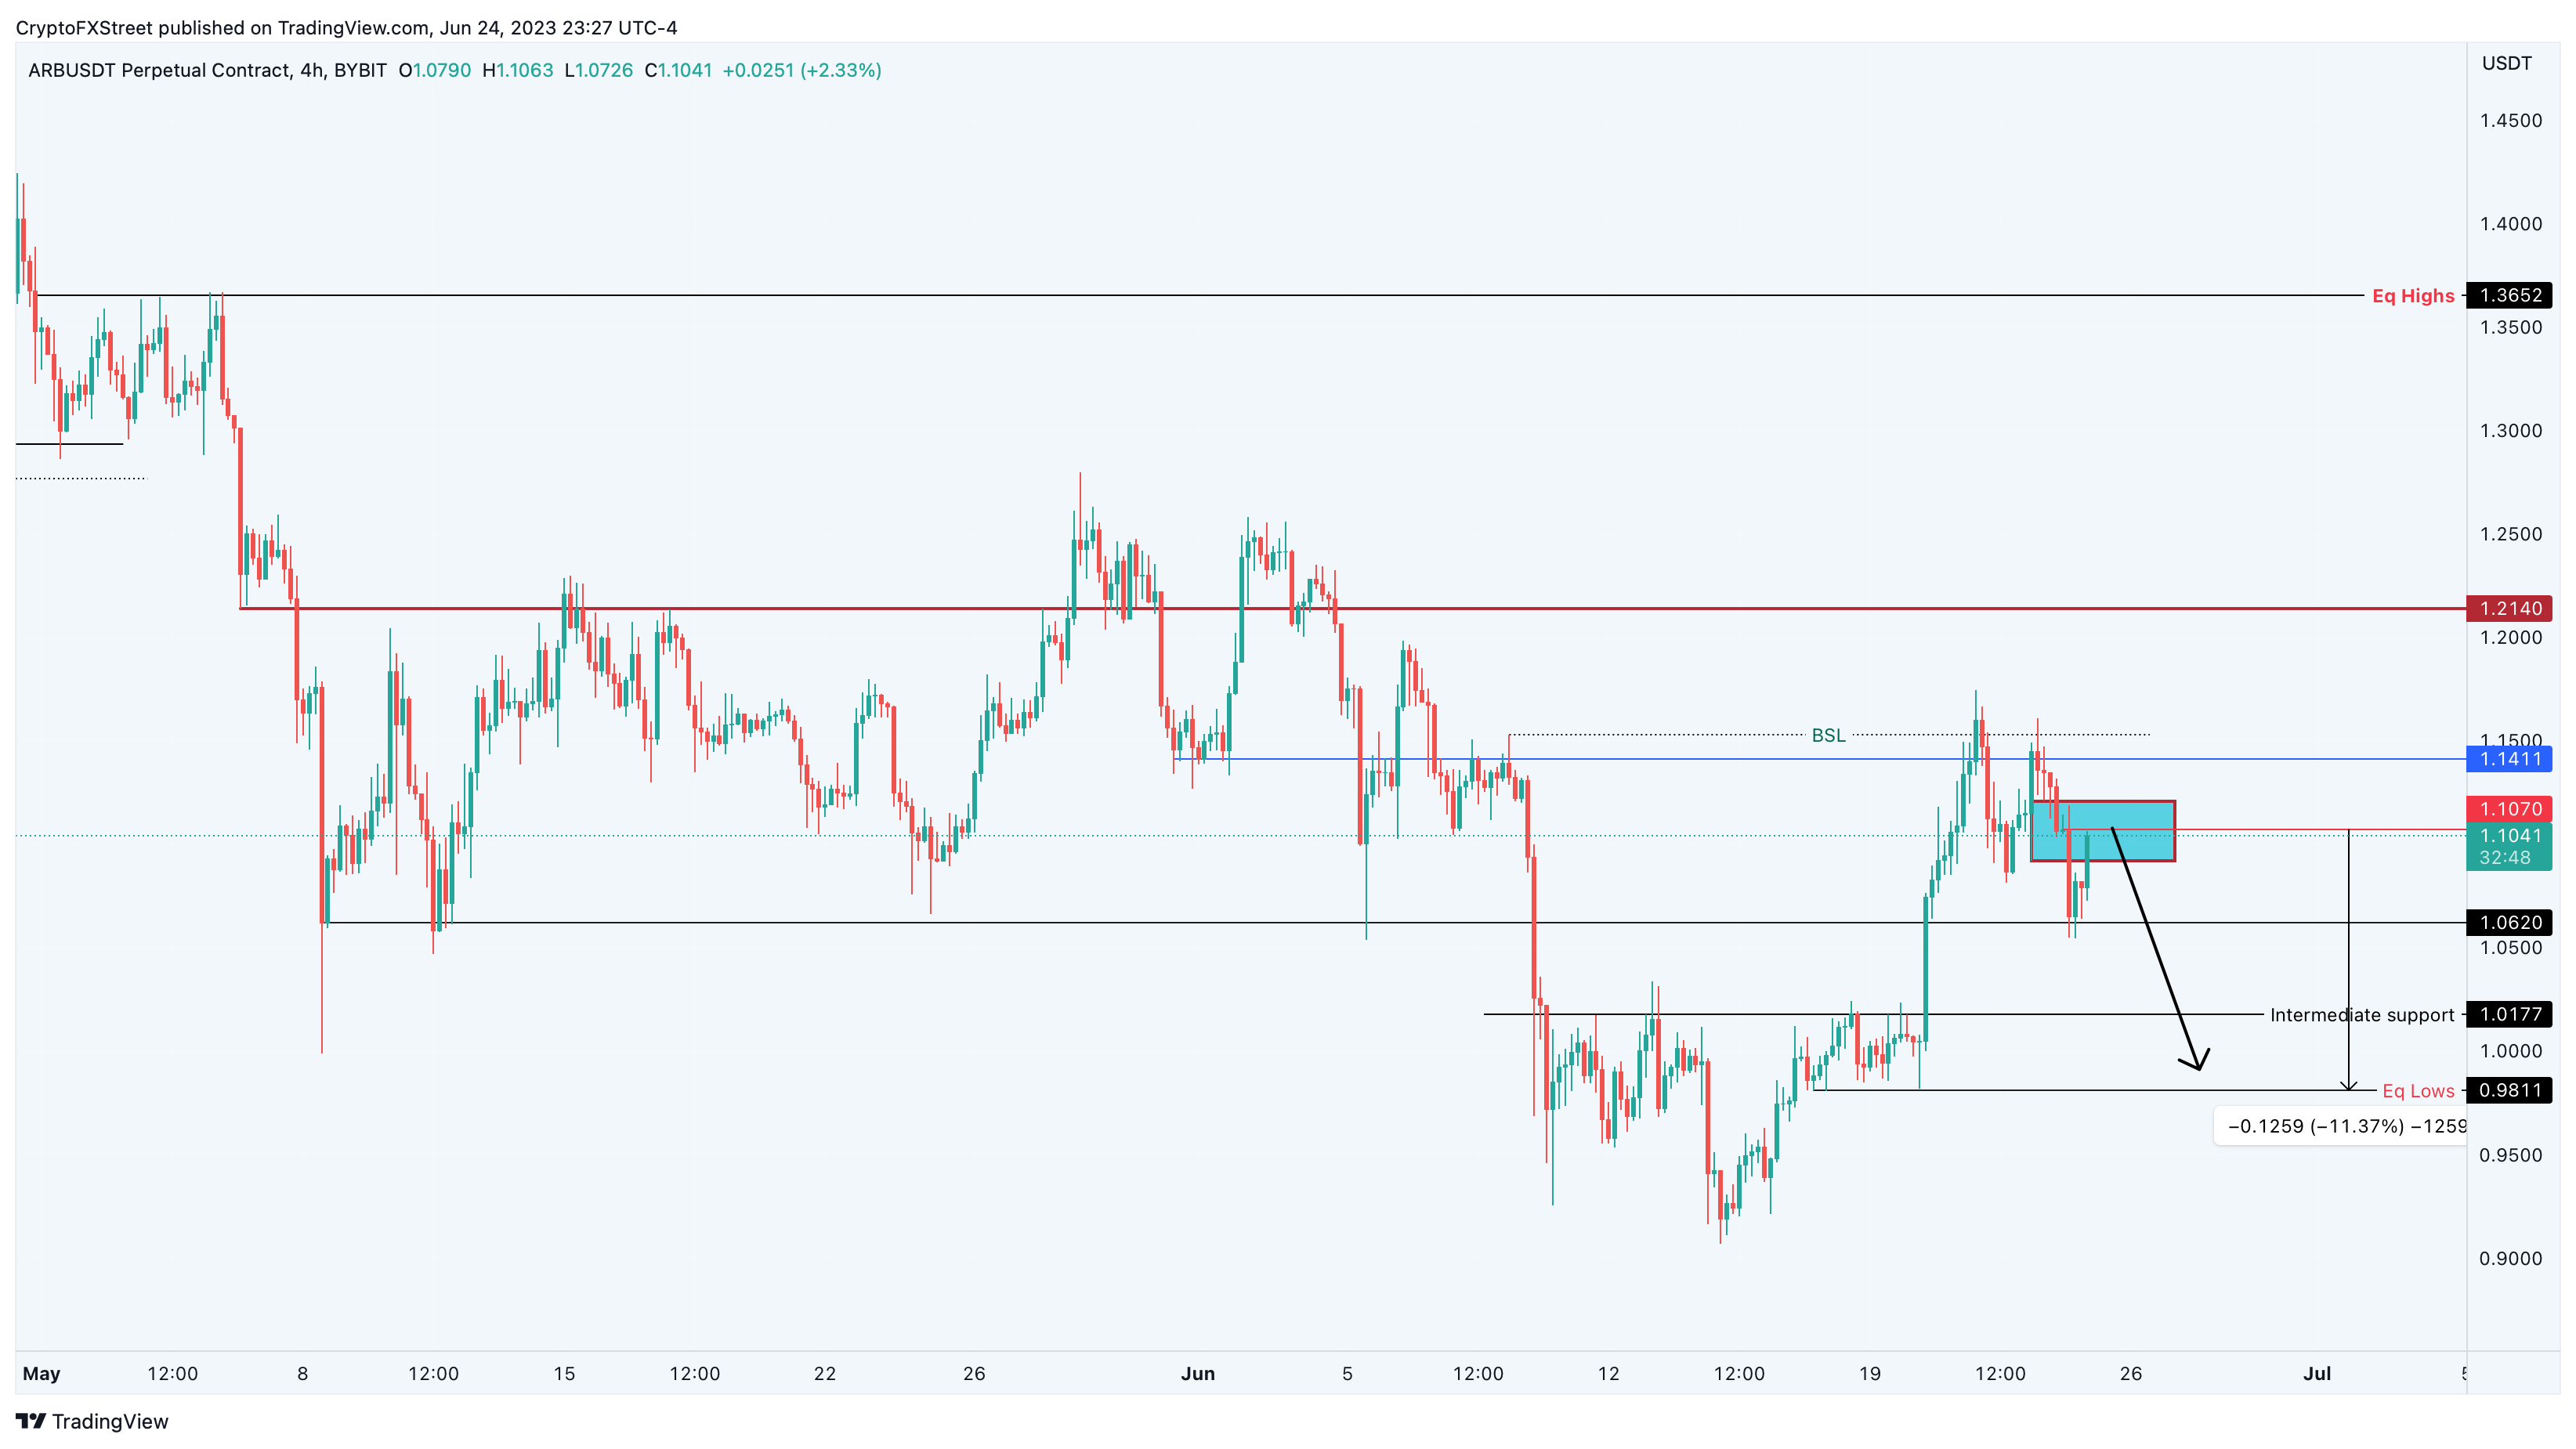
ARB/USDT 4-hour chart
While the bearish outlook makes logical sense, a four-hour candlestick close that flips the $1.14 hurdle into a support floor will open the stage for sidelined buyers to step in. This development will invalidate the bearish thesis for Arbitrum price and allow ARB to scale higher.
In such a case, Arbitrum price could retest the $1.21 resistance level.
Author

Akash Girimath
FXStreet
Akash Girimath is a Mechanical Engineer interested in the chaos of the financial markets. Trying to make sense of this convoluted yet fascinating space, he switched his engineering job to become a crypto reporter and analyst.