Zoom Zooms With Astro Power
Chaos Clinic for 9/18/2020
While many stocks are being negatively impacted by the pandemic, there is one stock going up so fast that one cannot ignore it: Zoom, symbol ZM. Almost everyone now knows about Zoom, thanks to the pandemic forcing remote learning and remote collaboration. Just as COVID-19 ripped people apart, Zoom reconnected them. Timely.
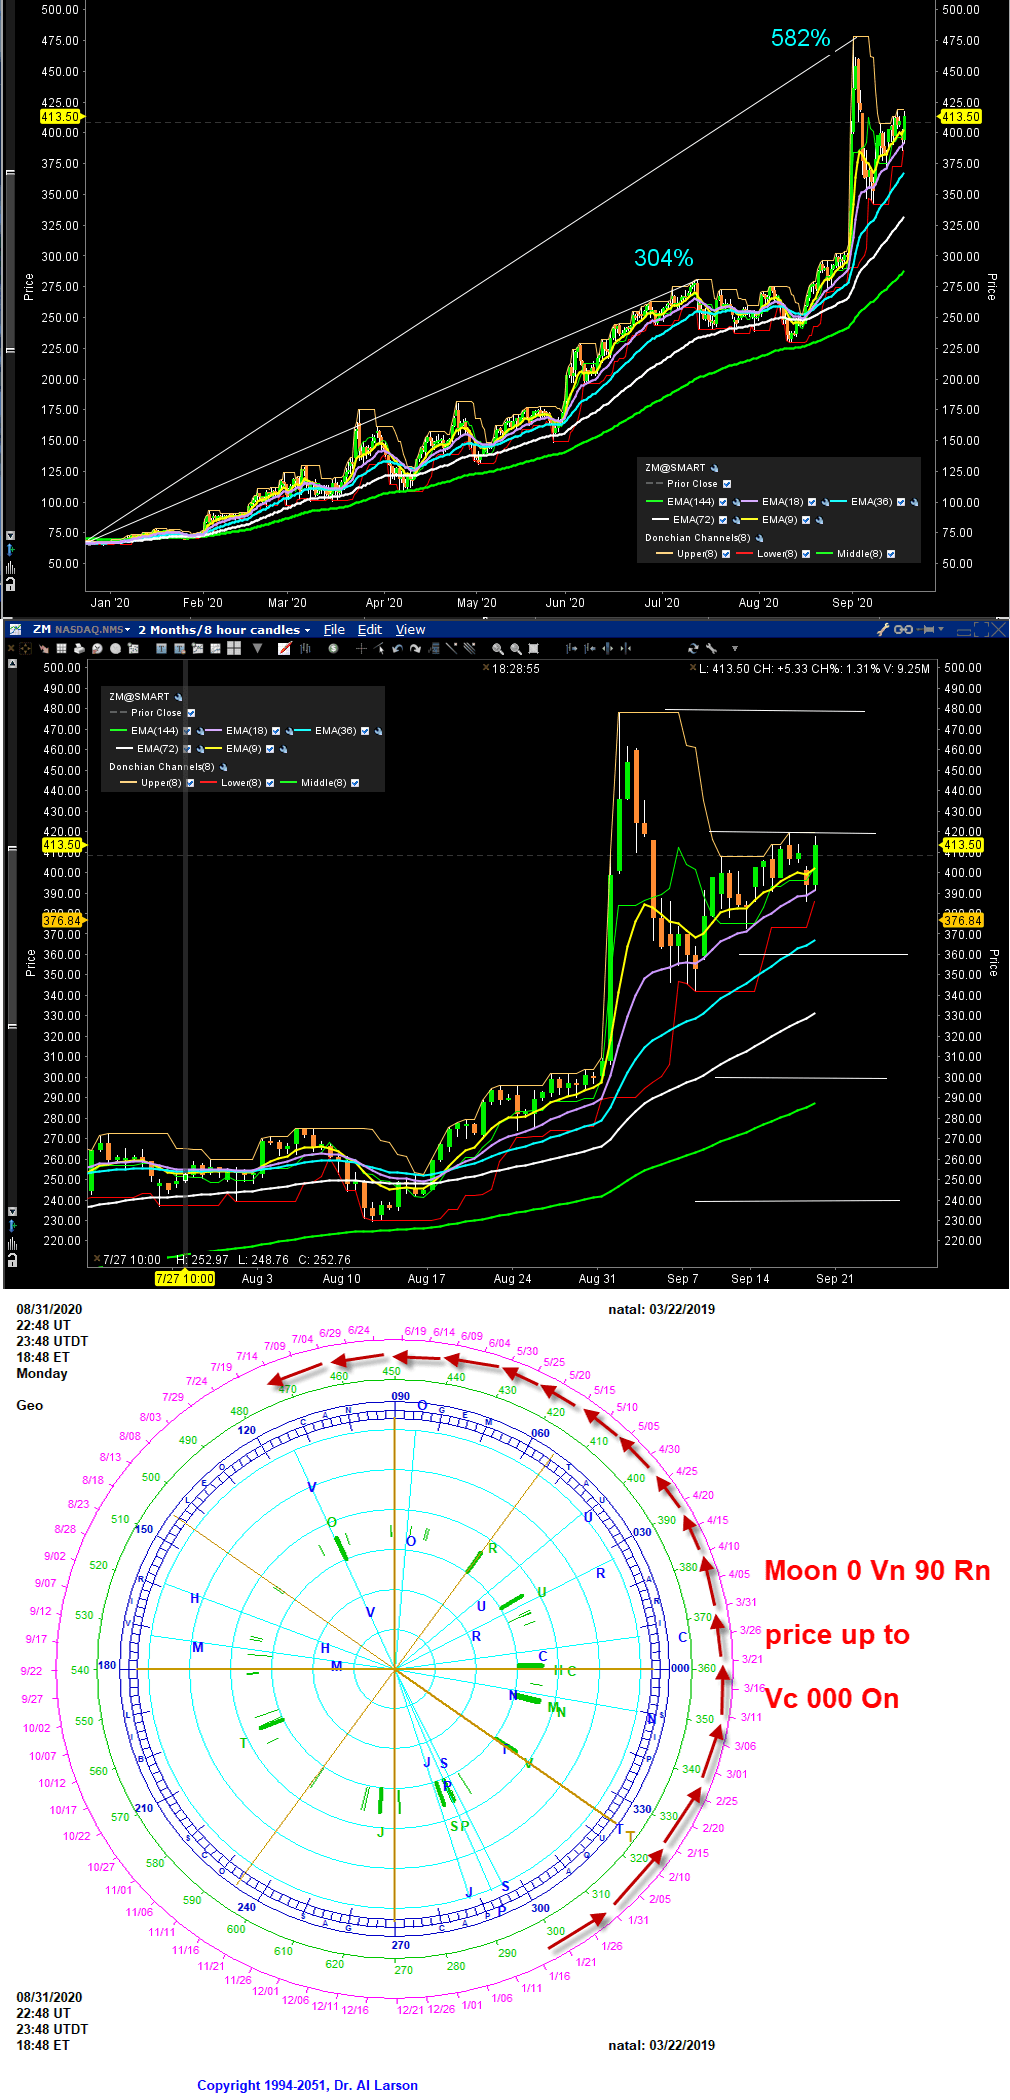
If that did not get your notice, the huge jump on August 31st should have. In just 24 hours, ZM jumped from near 330 to 478, a nearly 60% jump.
The three charts above show what's happening. At the beginning of 2020, ZM was about 72. Then as the pandemic became a serious problem in February and March, prices moved up. By mid-July prices had risen over 300 percent. Then the big jump in late August extended this gain to over 580 percent. This is shown on the top chart.
Clearly there is a lot of money chasing this stock. The second chart is an 8 hour bar chart with a rainbow of EXMAs. The 144 bar is a 48 day EXMA, the 72 is 24 day, the 36 is a 12 day, the 18 is the 6 day, and the 9 is the 3 day. After the big jump, the pullback was only to the 6 day. The slope of that EXMA remains up, suggesting continued rally.
Another thing to note on this chart are the support and resistance near 240, 300, 360, 420, and 480. These are all key aspects of the Wheel of 360 running on the 6th harmonic. This indicates a stock with a very energetic behavior. So a look at its natal chart is warranted.
The first trade natal date of ZM is 3/22/2019. This was a clever choice, since the spring equinox is the start of the natural year. On ZM's natal date, the Moon, Venus, Jupiter and Uranus filled four corners of a hexagon, hence the 6th harmonic behavior. It's the 6th harmonic that forms snowflakes.
Off that same natal Moon the Node, Uranus, and Saturn/Pluto form a square. That square provides the capability for ZM to frequency double, because it divides two of the hex sides in half. This gives ZM the ability to make chaotic moves.
An example of that is the third chart, showing the chaotic move of 8/31/2020. This is an ephemeris wheel showing current planets as blue lines and natal planets as green bars. It is my primary tool for studying specific events.
The red arrows show the ZM price move. As the current Moon conjoined natal Venus and squared natal Mars, prices jumped from natal Saturn/Pluto to natal Node, which was being transited by current Venus. So that frequency doubling square was highly energized, a clear case of Market Astrophysics in action. Whoever set the first trade date for ZM knew what they were doing.
So ZM is not only a "right stock at the right time", but one that is built to be a rocket. Understanding its structure helps evaluate it as an investment. To me, it looks like a stock to consider buying on dips. The natal hex gives seasonal energy points near 2/15, 4/11, 6/16, 8/19, and 10/16. Watch these dates for turns. Use the rainbow of EXMAs to help find the dips, and to set stops. It may also be useful to get an XGO energy chart for Zoom.
This content was published on Dr. Al Larson's Chaos Clinic which you can attend each Friday for free.
Dr. Al Larson has developed a complete Chaos Model of Markets, four unique courses that let you become a Certified Chaos Trader, some very unique eMylar fractal pattern overlays, and tools that permit forecasting individual stocks and markets years in advance. You can also sign up for a free weekly email, and attend a free Chaos Clinic on Fridays. To learn more, click on the author's profile.
Be sure to sign up for the free weekly email!
Author

Dr. Al Larson, PhD
MoneyTide.com
Dr. Al Larson holds a Ph.D. in Electrical and Computer Engineering from the University of Wisconsin. He is a 1964 Distinguished Graduate of the U. S. Air Force Academy.


