Yields are rebounding higher once again: This time for inflation risks, not Oil

CPI came in hotter yesterday, with headline inflation at 0.4% and core at 0.3%, both 0.1 percentage points above expectations.
Meanwhile, easing US–Iran tensions have pushed oil prices lower, although Tehran’s insistence that negotiations are not underway and Hormuz remains restricted keeps energy inflation risks alive.
Nevertheless, US Treasury yields surged overnight, printing strong bullish daily candles:
- 2 year yield → 3.94%
- 5 year yield → 3.12%
- 10 year yield → 2.38%
- 20 year yield → 1.75%
- 30 year yield → 1.57%
That has created an interesting technical read on our daily and 4H charts, suggesting a reversal may be in the works – so higher for longer yields.
More importantly, the 2y yield is rising faster than the 30y, creating another obstacle for the bullish gold thesis.
Bear in mind that this coming Friday’s US PPI report (Nov 13) could either reinforce this outlook or turn it on its head.
Yield charts analysis
Below are the US 2y, 5y, 10y, and 30y charts (left to right in that order).
The orange band is the 20 day EMA with 1 standard deviation; you can achieve this visual indicator by using the Bollinger Band.
We use these bands to assess the strength of each US yield trend. Once yields break beyond the upper or lower band, they tend to maintain that direction, often retesting the band without breaking through to the opposite side.
Daily timeframe chart
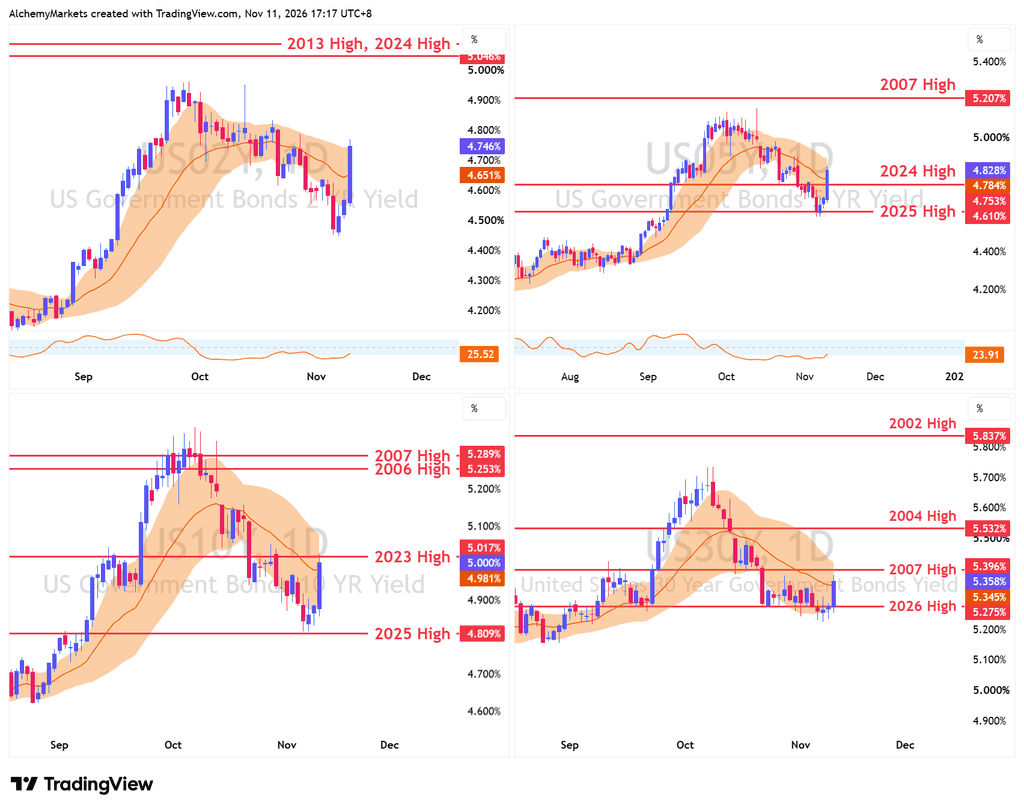
Notice how the 2y yield is running ahead of the others; and from a technical perspective, it looks like a bullish consolidation moving into the breakout stage (if this were an equity, gold, or crypto).
Currently, it is threatening a break of the orange band, and that means a flip into a bullish trend, where yields can find support on the band on retraces.
The other yields are lagging behind – but the 2y yield is potentially a leading indication of how yields may collectively move higher in the near future.
Four-hour timeframe chart
On the 4H timeframe, the trend that is most cleanly suppressing yields on the 4H timeframe is the 50-EMA (1sd).
Notice how US 2y, 5y, 10y, and 30y have all collectively broken upwards of their trends.
That behavioural change suggests a retracement into these bands from here could produce a continuation.
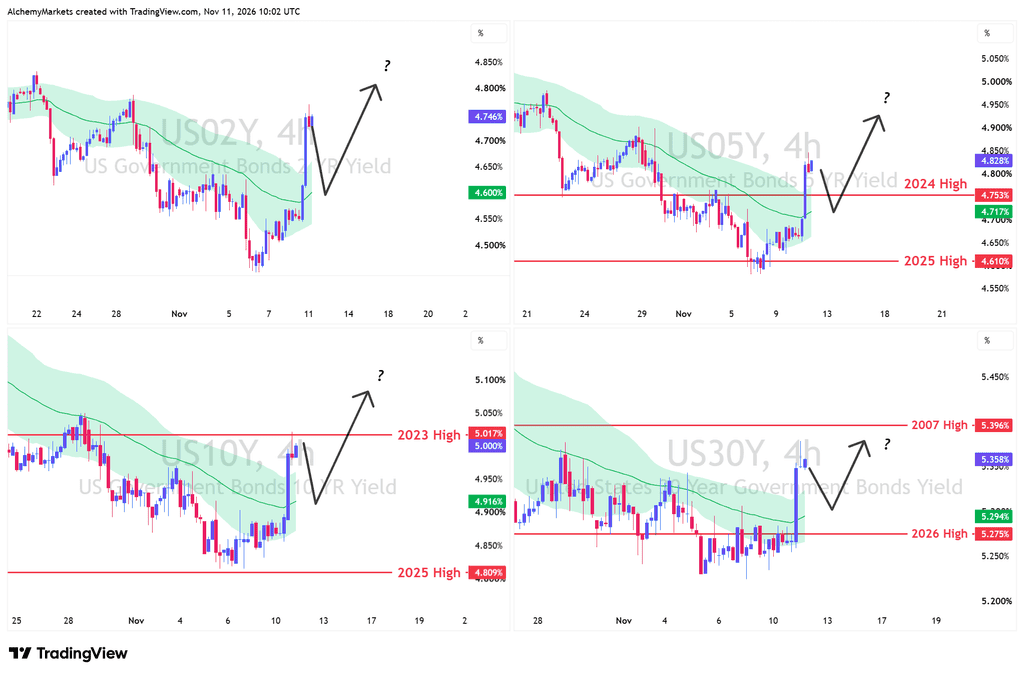
We’ll be keeping a close eye on this in the upcoming hours and days.
Gold is once again in non-constructive conditions
Whenever the 2y yield rises faster than the 30y yields, gold tends to stay suppressed to the downside.
The black line below is the Gold price and the candles represent the difference (Spread) between the US-2y and US-30y yield.
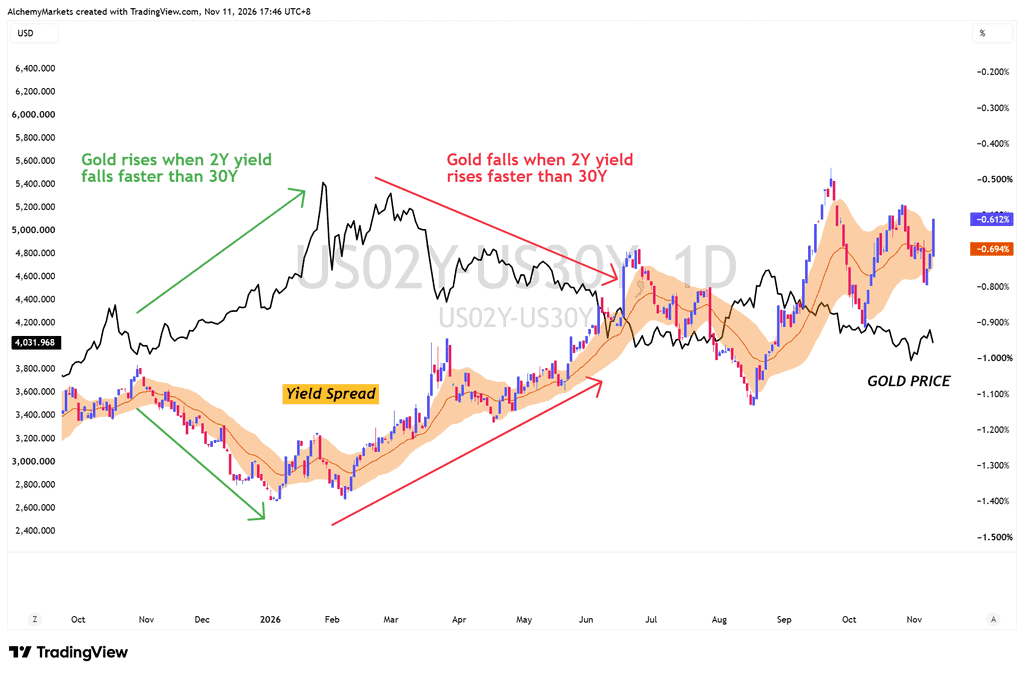
Notice how the yield spread has broken above the 20D-EMA (1sd) again. The previous times this happened, the spreads continued to widen, and gold continued to slump.
This on a technical level suggests that even if Gold rises, it is fighting against conditions that are favouring gold to the downside.
Gold four-hour chart
A quick read of this chart suggests that gold is currently sandwiched between support at 4,034 and resistance at 4,100 to 4,150.
However, a break higher from here could see gold test the 4,180 – 4,220 resistance, where a more significant anchored vWAP sits.
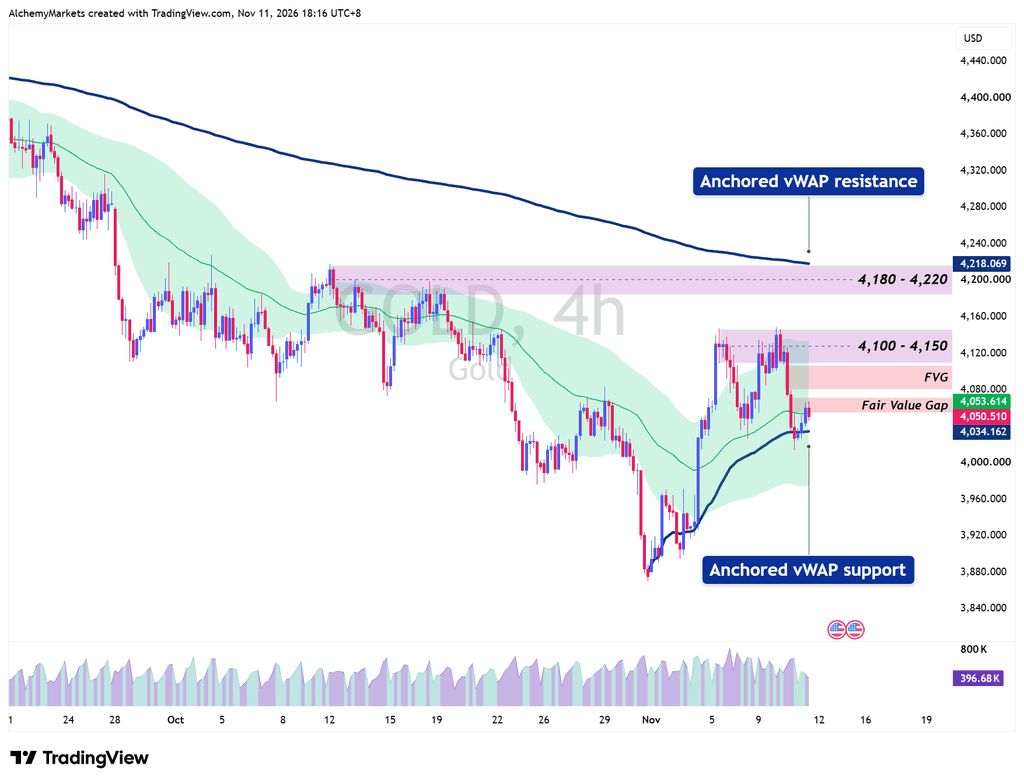
We also must acknowledge that the 4H-50 EMA (1sd), visualised in green, was the suppressive force on the Gold 4H chart.
And currently is now hinting at 4H momentum to the upside.
Therefore, short term upside is not out of the picture. It’s just that gold is fighting a lot of resistances if it is to make its way higher.
There are also two Fair Value Gaps that could kick in as resistance should we begin to make that journey towards 4,150.
Note that if the PPI on Friday comes in more dovish than expected, we could see this “bullish outlook” on yields – and therefore bearish outlook on Gold and equities – flip around.
Author

Zorrays Junaid
Alchemy Markets
Zorrays Junaid has extensive combined experience in the financial markets as a portfolio manager and trading coach. More recently, he is an Analyst with Alchemy Markets, and has contributed to DailyFX and Elliott Wave Forecast in the past.