Yield Curve Flattens Considerably: Surprising Economic Strength Revisited

Curve Watchers Anonymous is taking a hard look at the yield curve in light of the now odds-on market view of a March rate hike.
Before looking at the chart below, where do you think rates are relative to January 2014? Up, down, or sideways?
Yield Curve Since 1998
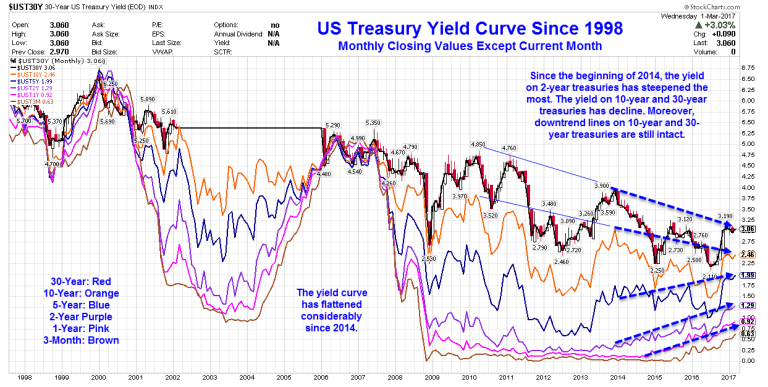
The chart shows monthly closing values except for the current month.
Change Since January 2014
| Duration | 1-Jan-14 | 1-Mar-17 | Direction |
|---|---|---|---|
| 30 Year | 3.96 | 3.06 | -0.90 |
| 10 Year | 3.04 | 2.46 | -0.58 |
| 5 Year | 1.75 | 1.99 | 0.24 |
| 2 Year | 0.38 | 1.29 | 0.91 |
| 1 Year | 0.13 | 0.92 | 0.79 |
| 30 Days | 0.07 | 0.63 | 0.56 |
The 2-30 spread flattened by a whopping 181 basis points in just over two years.
The 2-10 spread flattened by 149 basis points.
A flattening of the yield curve is not good for bank profits. Rising 10-year yields since mid-2016 are not good for mortgages or housing affordability.
Not to worry, despite poor economic reports, Fed governors have stated: “This is a surprisingly strong economy.”
Author

Mike “Mish” Shedlock's
Sitka Pacific Capital Management,Llc
Mike “Mish” Shedlock is a registered investment advisor for SitkaPacific Capital Management.


