Yen reversal imminent? What “smart money” positioning and USD/JPY charts suggest

Is the Japanese Yen primed for a comeback? Our deep dive into commercial trader activity and key technical indicators paints a compelling picture of a potential turning point for the Yen. By analyzing the positioning of the "smart money" and crucial price levels for USD/JPY, we've uncovered a possible trading opportunity you won't want to miss.
Yen commercial long/short ratio (CFTC data)
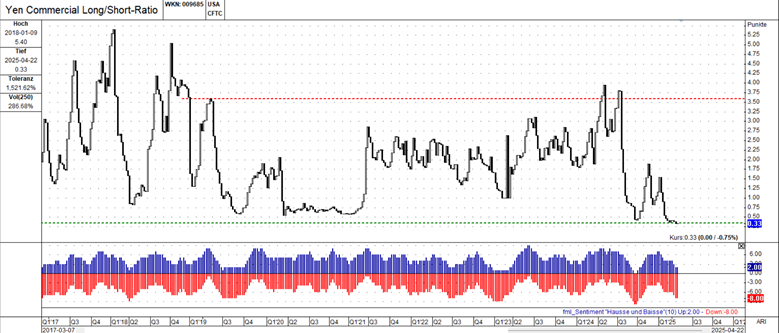
This chart displays the Commercial Long/Short Ratio for the Japanese Yen, derived from CFTC (Commodity Futures Trading Commission) data. This ratio reflects the positioning of commercial traders (often considered "smart money") in Yen futures contracts. A higher ratio indicates a greater number of long positions relative to short positions, while a lower ratio suggests the opposite. The chart shows a history of the ratio fluctuating within a defined range, historically bouncing between roughly 0.50 and 5.40.
The most striking feature is the recent dramatic plunge to the lower end of its historical range, reaching approximately 0.33. This suggests commercial traders have significantly increased their short positions (or reduced their long positions) on the Yen. The extreme low level could indicate an oversold condition, potentially signaling a future reversal. However, oversold conditions can persist for extended periods. The sentiment indicator at the bottom generally confirms the price action, showing a strong bearish sentiment correlating with the declining ratio.
Yen commercial long/short ratio with Bollinger bands and z-score
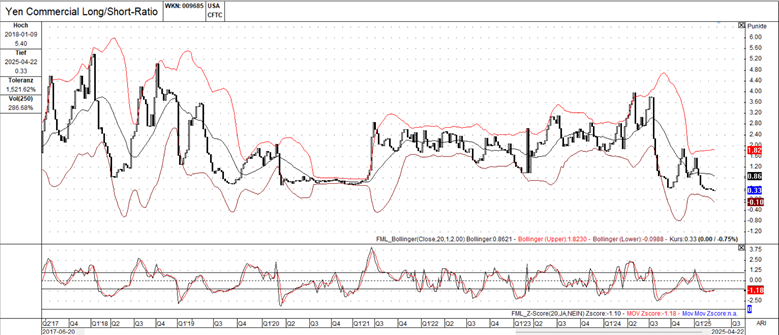
This chart displays the same Yen Commercial Long/Short Ratio as the previous one, but with added technical indicators: Bollinger Bands and a Z-Score indicator. The price action is clearly outside the lower Bollinger Band, reinforcing the idea of an oversold condition. This suggests that the ratio is trading at an extreme relative to its recent volatility. However, it's important to note that price can remain outside the bands for a while during strong trends. The Z-Score indicator in the bottom pane is highly negative, further supporting the oversold argument. Z-Scores measure how far a data point is from the mean in terms of standard deviations. A very low Z-Score indicates an extreme deviation from the average, often suggesting a potential reversal.
Both the Bollinger Bands and the Z-Score confirm the extreme bearish positioning highlighted in the previous chart.
USD/JPY forex chart
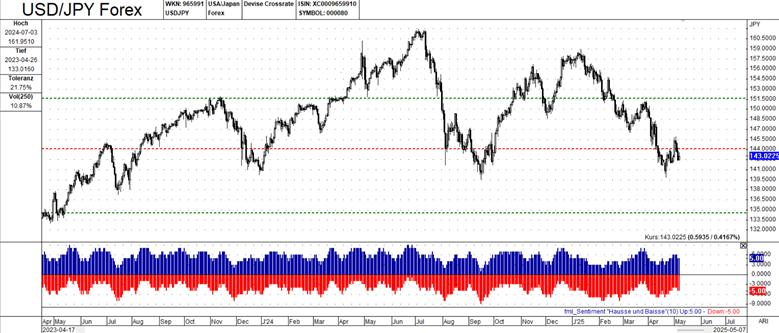
This chart clearly shows an overall uptrend in USD/JPY over the period shown. There are key resistance levels marked by red lines, with the most recent one around 143.822. The price has recently broken below this level. A key support level is marked by the green line around 133.016. This level has held in the past and could provide support again. The sentiment indicator at the bottom shows a bearish shift in sentiment, coinciding with the recent price decline.
Here's the crucial takeaway:
- Yen looks oversold: The Yen Commercial Long/Short Ratio charts strongly suggest that the Yen is oversold based on commercial trader positioning, Bollinger Bands, and Z-Score analysis. This heightens the chances of a significant Yen reversal.
- USD/JPY at a crossroads: The USD/JPY chart shows the pair has broken below a recent resistance level, and market sentiment has turned bearish. This aligns perfectly with the potential for Yen strength.
- The contrarian trade?: This apparent contradiction – a weak Yen positioning alongside a potential top in USD/JPY – often spells a significant trading opportunity. If the commercial traders are right, expect a notable move downwards in USD/JPY as the Yen gains strength.
Conclusion
Our analysis reveals a potentially lucrative situation brewing in the Yen market. The heavily oversold conditions indicated by commercial traders (as seen in the Yen Commercial Long/Short Ratio charts) combined with the topping signals in USD/JPY suggest a strong possibility of a Yen reversal.
Important note: While technical analysis provides valuable probabilities, it's not a crystal ball. Keep a close eye on fundamental factors, especially interest rate differences and the monetary policies of the Bank of Japan and the Federal Reserve, as these will ultimately drive the Yen's direction.
Stay informed: This analysis highlights a potential opportunity, but continuous monitoring and careful risk management are essential for trading the Yen.
Author

FxPro Traders Research Team
FxPro Traders
The FxPro Traders Research Team delivers advanced analysis and strategies designed to empower your success in today's dynamic forex markets.


