WTI Slides After Hitting Resistance Near a Prior Medium-term Uptrend line

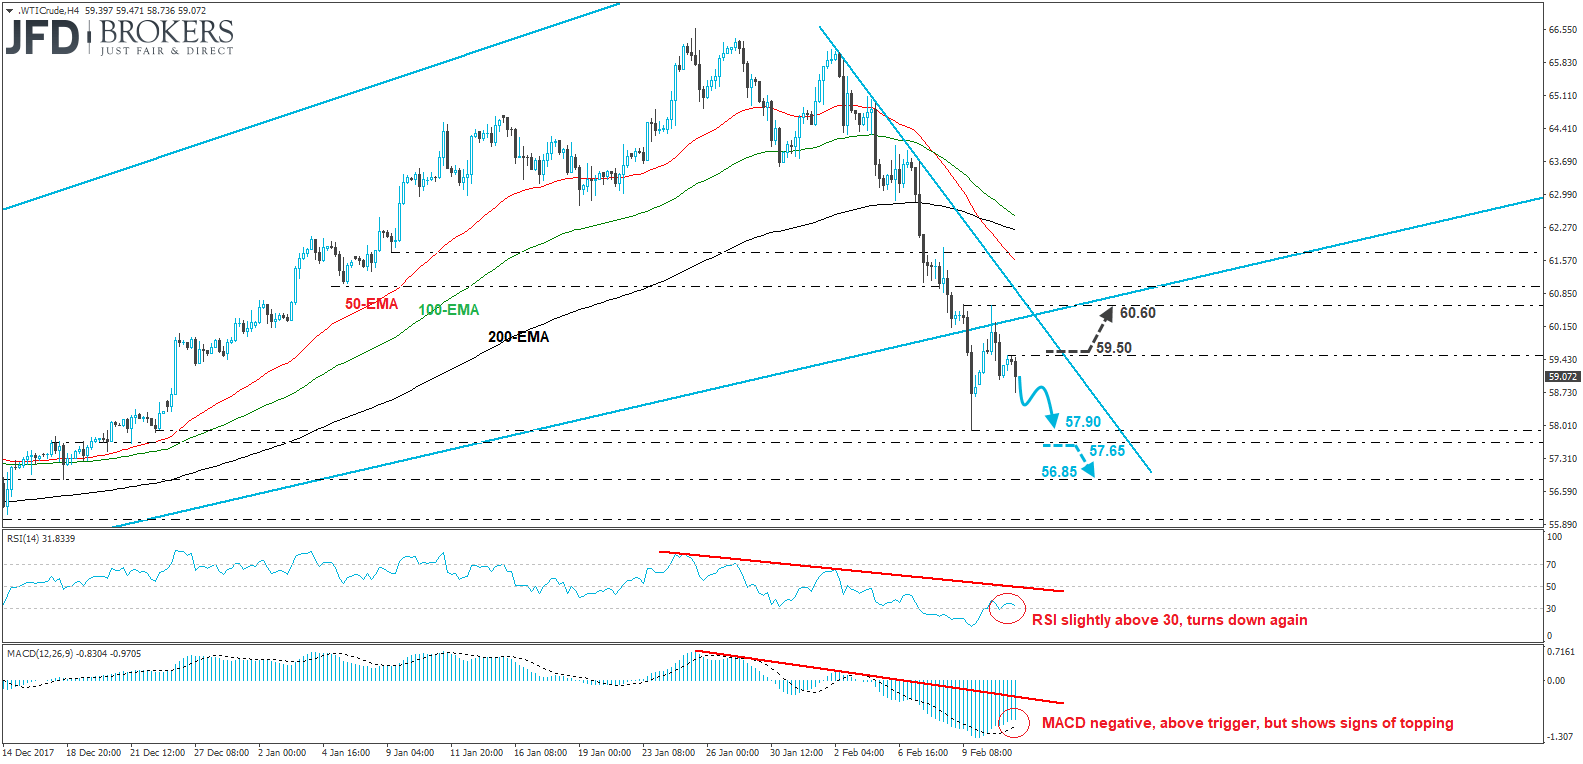
WTI traded lower yesterday, after it hit resistance at 60.60, slightly above the prior medium-term uptrend line taken from the low of the 31st of August. That line was broken to the downside on the 9th of February, a break that led to a tumble towards 57.90. Having that in mind, and also considering that the price structure on the 4-hour chart continues with lower peaks and lower troughs below the short-term downtrend line taken from the peak of the 2nd of February, we believe that the near-term picture is negative for now.
If sellers stay in the driver’s seat, then we may see them aiming for another test near Friday’s low of 57.90. That said, we would like to see a dip below 57.65 before we get confident on more downside extensions. Such a break is possible to set the stage for our next support level of 56.85.
Taking a look at our short-term momentum studies, we see that the RSI, although it recently exited its below-30 territory, it turned down again and appears ready to move back within that zone. The MACD stands below zero, above its trigger line, but shows signs of topping as well. These indicators enhance our view for WTI to continue trading lower, at least towards Friday’s lows of 57.90.
On the upside, a decisive move above 59.50 may signal the break above the short-term downtrend line drawn from the peak of the 2nd of February and may open the way for our next resistance obstacle of 60.60, which stands slightly below the prior medium-term uptrend line taken from the low of the 31st of August.
Are you interested in institutional-grade Research? Sign up for our Weekly Strategic Report HERE – it’s free!
Article written by Charalambos Pissouros, Senior Market Analyst for JFD Brokers
You want more? Subscribe to our JFD YouTube Channel HERE. To contact Charalambos send an email to [email protected]
Author

JFD Team
JFD


