WTI: Confluence of ICT, Gann & Astro cycles point toward bullish expansion

The market has been moving in a very telling way lately. After dropping from 65.80 down to 61.65, we’ve seen a healthy rebound to 62.92. This isn’t random noise, several technical signals are lining up, and they all suggest that a bigger bullish move could be on the horizon.
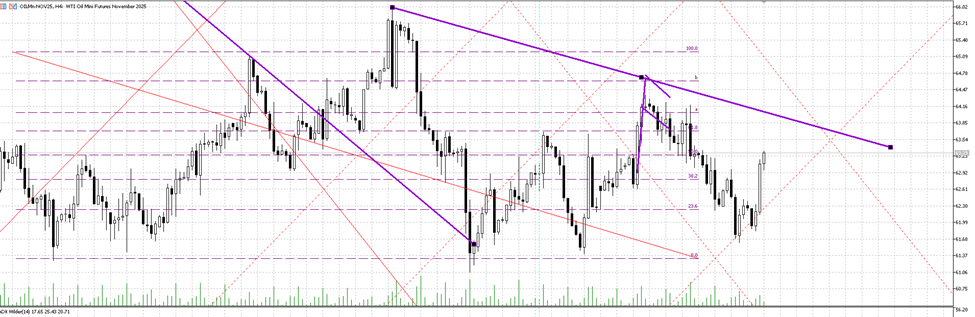
Right now, there’s a gap between 63.70 – 63.95 that traders are watching closely. Think of it as unfinished business on the chart. Add to that, there’s a key liquidity pool sitting above 64.55 and once price pushes through, it could act as fuel for the next leg up.
On the downside, 61.85 is the line in the sand. If price slips below that, it means sellers are in control again.
Gann angles explanation
Looking at Gann angles, the story gets even more interesting:
- The 1x1 angle from the 61.85 low points directly to resistance at 64.55 around Sept 26. A breakout here would confirm strength.
- The 2x1 angle sets the next target around 67.78 by early October.
- And the 3x1 angle? It’s calling out 72.20 by Oct 8, right at a major cycle convergence.
What we’re seeing now looks like a corrective wave (ii). If that’s right, then wave (iii), the strong move, is still ahead of us.
Fibonacci adds to the case
From the recent swing, Fibonacci levels are marking important checkpoints:
- 63.37 has already been tested.
- 64.55 is the breakout validation level.
- Beyond that, 67.78 and 72.20 become natural upside targets.
We’re also sitting inside a low-volatility band between 62.40 – 63.40, which often signals quiet accumulation before expansion.
Astro cycles in play
If you follow astro–market timing, the next couple of weeks are packed with catalysts:
- Sept 28 (Mars trine Pluto) could spark volatility.
- Oct 5 (Venus square Saturn) may bring some chop.
- Oct 8 (Solar Eclipse) is the big one—it lands right on Gann’s 3x1 projection at 72.20, making it a high-probability turning point.
Trading expectation
Here’s how traders might approach it:
- Look for a breakout above 64.55. That’s the signal. Place a stop around 61.21 and aim for 67.78 first, then 72.20 into the Oct 8 window.
- Or buy the dip near 62.42 with the same stop and targets.
- Risk Check: A sustained close below 61.21 cancels the bullish outlook and shifts focus back to the 59.80–60.20 zone.
ICT liquidity pools, Gann projections, Fibonacci patterns, even astro cycles—are pointing in the same direction. Once price clears 64.55, the stage looks set for a bullish expansion, with 67.78 as the first stop and 72.20 as the bigger cycle-driven target into early October.
For now, patience and well-placed entries are key. The charts suggest that the real move hasn’t even started yet.
Author

Faysal Amin
Mind Vision Traders
Faysal Amin is a seasoned financial analyst and market strategist with over a decade of experience in global markets, including equities, forex, and commodities.


