Would low PCE index take Gold to the moon?

The PCE Index statistics were released today, and you might wonder what impact they will have on the price of gold.
Let’s dig in.
One might think that PCE is a critical driver of gold prices (and thus, you might be concerned with what the number is going to be), and there is some truth to it, but looking at how those reports have indeed influenced gold price provides extra context to what might seem obvious.
Fed's perspective
Oh, and why am I discussing this particular statistic? Because the Fed told us on numerous occasions that it’s the statistic that they view as particularly important. Therefore, based on what the PCE numbers are going to be, investors might expect the Fed to cut (or not) interest rates in the future. And since the markets are forward-looking, those expectations are likely to already drive price moves.
What might seem obvious is the following:
If inflation (as measured by the PCE) is below expectations, gold will go up significantly, and if inflation (PCE) is above expectations, gold will go down significantly.
Seems to make sense, but let’s remain skeptical and let’s check.
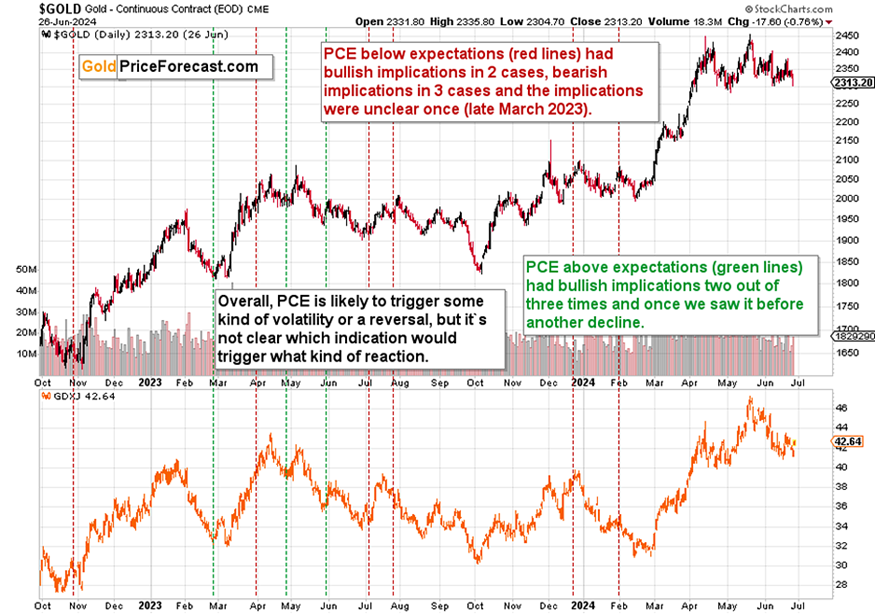
The red lines mark the cases when PCE was below expectations, and the green lines mark the cases when PCE was above expectations.
What happened in reality?
PCE below expectations:
In 2 out of 6 cases, bullish implications
In 3 out of 6 cases, bearish implications
In 1 out of 6 cases, unclear expectations (late March 2023 – first a move up and then a bigger move down)
To sum up, PCE numbers below expectations had mostly bearish implications, even if the immediate-term or short-term reaction was bullish.
PCE above expectations:
In 1 out of 3 cases, bearish implications
In 2 out of 3 cases, bullish implications (one of them was rather unclear – in late April 2023, we first saw a short-term upswing and then a medium-term downswing)
To sum up, PCE numbers above expectations had mostly bullish implications, but it wasn’t particularly clear.
Overall, PCE is a rather weak indication of the direction in which the gold market is about to move, and in general PCE below expectations tends to have bearish implications for gold and PCE above expectations tends to have unclear or slightly bullish implications.
It’s a rather good indication that we likely have a turning point in gold right now, and it might be best to determine the direction in which gold is about to move based on other factors.
After I sent out today’s early heads-up Gold Trading Alert, in which I wrote about re-entering short positions in gold (with gold at about $2,347), gold moved slightly higher when PCE was released and now it’s turning south again.
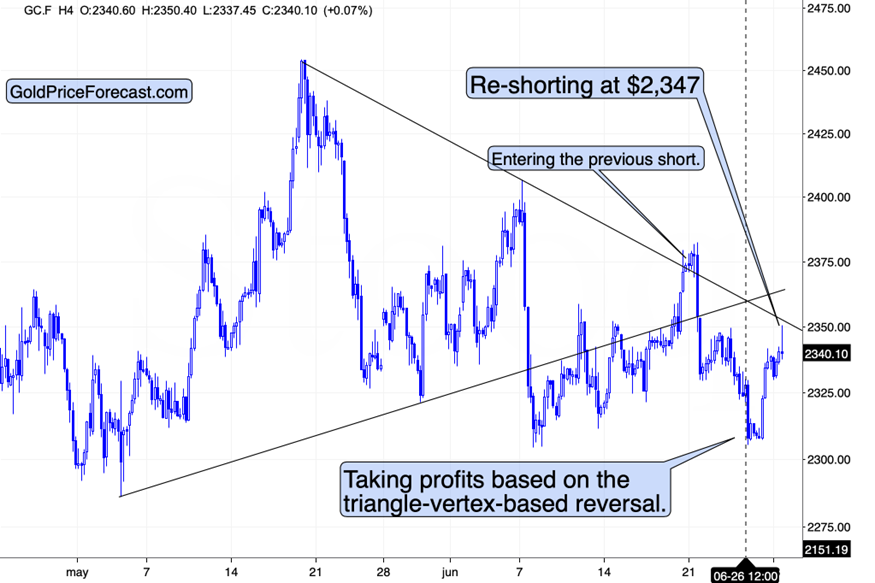
Why did I do it? Because on a short-term basis gold already completed the rebound that was likely to happen. Gold reached its declining resistance line and since this line helped to keep gold’s rally in check on June 20, it was likely to do the same today. And that seems to have happened.
Of course, that was just a very short-term indication.
There are multiple techniques that point to lower gold prices in the following weeks, and in today’s analysis, I’d like to show you three that point to the $2,200 or its proximity as the next target for gold’s rebound.
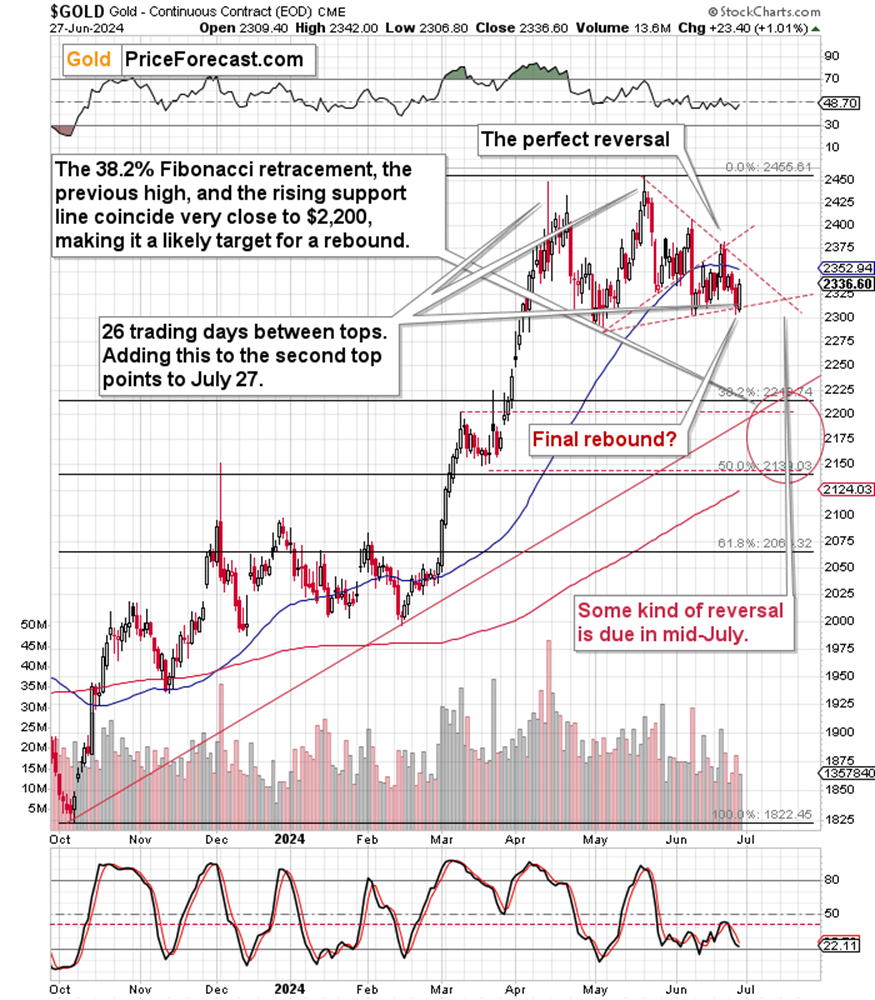
These techniques are:
- The 38.2% Fibonacci retracement,
- The support provided by the previous high,
- The rising support line.
Expected Gold price movement
How will gold deal with this kind of support? Simple - it’s likely to bounce from there. This also means that gold is likely to slide by about $150 from the current price levels, making this trading opportunity worthwhile.
Moreover, please note that gold’s next triangle-vertex-based turning point is due in mid-July. That’s where the support and resistance lines cross. Before dismissing this technique as ridiculous, please note how perfectly it allowed us to time the entry for the previous short position in gold.
This means that gold is likely to form some kind of reversal in mid-July. At this point, it’s not clear what kind of reversal it will be. We could see a quick (say, weekly) slide to $2,200 in gold soon, and then a rebound with a top in mid-July. However, a more conservative estimate would be to see the next short-term bottom in mid-July. We’ll see – we’ll know when gold moves to / below $2,200.
This kind of decline might seem big, but let’s keep in mind that based on the entire pattern, we’re likely looking at the early stage of the move to $1,800 or so, which is what is in perfect tune with two monthly reversals that we saw in gold in April and May.
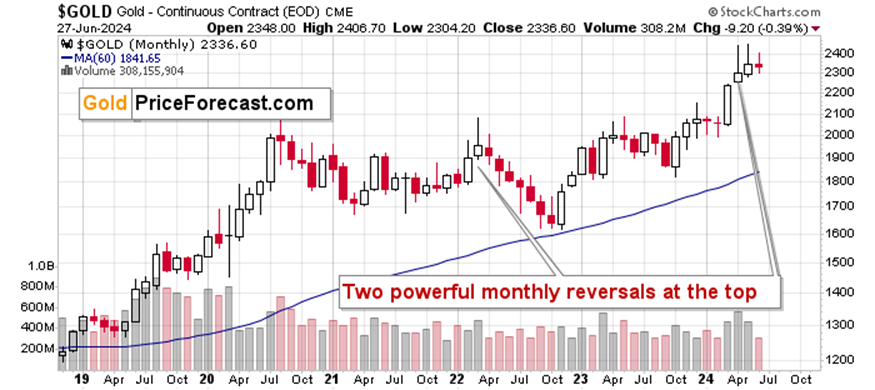
Depending on the way gold performs today, we might see a third monthly reversal in a row (if gold ends lower), but it’s also possible that we’ll see gold at similar price levels as it is right now or somewhat higher. As long as it’s not a huge rally, the bearish implications of the previous monthly reversals will remain intact.
Want free follow-ups to the above article and details not available to 99%+ investors? Sign up to our free newsletter today!
Want free follow-ups to the above article and details not available to 99%+ investors? Sign up to our free newsletter today!
Author

Przemyslaw Radomski, CFA
Sunshine Profits
Przemyslaw Radomski, CFA (PR) is a precious metals investor and analyst who takes advantage of the emotionality on the markets, and invites you to do the same. His company, Sunshine Profits, publishes analytical software that any


