Will Santa be coming to town?? [Video]
![Will Santa be coming to town?? [Video]](https://editorial.fxstreet.com/images/Macroeconomics/Countries/Europe/Eurozone_countries/Spain/plaza-del-obradoiro-y-catedral-santiago-de-compostela-la-coruna-40485440_XtraLarge.jpg)
US Dollar: Mar '23 USD is Down at 103,740.
Energies: Feb '23 Crude is Up at 79.80.
Financials: The Mar '23 30 Year T-Bond is Up 15 ticks and trading at 128.20.
Indices: The Mar '23 S&P 500 Emini ES contract is 10 ticks Lower and trading at 3903.25.
Gold: The Feb'23 Gold contract is trading Down at 1823.70. Gold is 17 ticks Lower than its close.
Initial conclusion
This is not a correlated market. The dollar is Down, and Crude is Up which is normal, but the 30 Year T-Bond is trading Higher. The Financials should always correlate with the US dollar such that if the dollar is lower, then the bonds should follow and vice-versa. The S&P is Lower, and Crude is trading Higher which is correlated. Gold is trading Lower which is not correlated with the US dollar trading Down. I tend to believe that Gold has an inverse relationship with the US Dollar as when the US Dollar is down, Gold tends to rise in value and vice-versa. Think of it as a seesaw, when one is up the other should be down. I point this out to you to make you aware that when we don't have a correlated market, it means something is wrong. As traders you need to be aware of this and proceed with your eyes wide open. Currently all of Asia is trading mainly Higher with the exception of the Shanghai and Sensex exchanges. All of Europe is trading mainly Lower with the exception of the London exchange which is Higher. .
Possible challenges to traders today
-
Final GDP is out at 8:30 AM EST. This is Major.
-
Final GDP Price Index is out at 8:30 AM EST. This is Major.
-
Unemployment Claims are out at 8:30 AM EST. This is Major.
-
CB Leading Index is out at 10 AM EST. This is Major.
-
Natural Gas Storage is out at 10:30 AM EST. This is Major.
Treasuries
Traders, please note that we've changed the Bond instrument from the 30 year (ZB) to the 10 year (ZN). They work exactly the same.
We've elected to switch gears a bit and show correlation between the 10-year bond (ZN) and the S&P futures contract. The S&P contract is the Standard and Poor's, and the purpose is to show reverse correlation between the two instruments. Remember it's likened to a seesaw, when up goes up the other should go down and vice versa.
Yesterday the ZN hit a Low at around 9:50 AM EST. The S&P was in a Downswing at around the same time. If you look at the charts below ZN gave a signal at around 9 AM and the S&P gave a signal at around the same time. Look at the charts below and you'll see a pattern for both assets. ZN hit a High at around 9 AM and migrated Lower. These charts represent the newest version of MultiCharts and I've changed the timeframe to a 15-minute chart to display better. This represented a Short opportunity on the 10-year note, as a trader you could have netted about a dozen ticks per contract on this trade. Each tick is worth $15.625. Please note: the front month for the ZN is now Mar '23. The S&P contract is now Mar' 23 as well. I've changed the format to Renko Bars such that it may be more apparent and visible.
Charts courtesy of MultiCharts built on an AMP platform
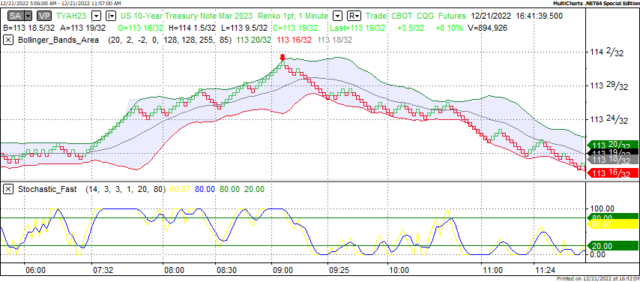
ZN - Mar 2023 - 12/21/22
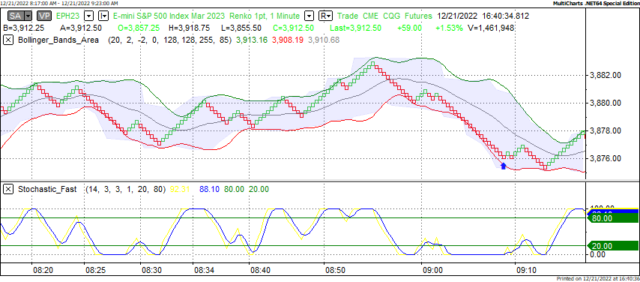
S&P - Dec 2022 - 12/21/22
Bias
Yesterday we gave the markets an Upside bias as Gold and the Bonds were down and that usually reflects an Upside Day. The markets didn't disappoint as the Dow advanced 527 points and the other indices migrated to the upside as well. Today we aren't dealing with a correlated market and our bias is Neutral.
Could this change? Of Course. Remember anything can happen in a volatile market.
Commentary
Yesterday we gave the markets an Upside bias as we didn't think the markets were done migrating Higher. On Tuesday they were up slightly but yesterday was a true Upside Day. We've been laboring long wondering if this year we will see a Santa Claus Rally or some semblance of one. It may very well be that yesterday was that rally. We will have to see if the markets wish to go into the Christmas Holiday on a positive. But as in all things, only time will tell.
Author

Nick Mastrandrea
Market Tea Leaves


