Where are interest rates headed? Is the Fed correct or the EUR/USD curve?
The Eurodollar curve implies four quarter-point cuts are on the way starting in 2023. The Fed believes otherwise. Let's discuss stock market implications.
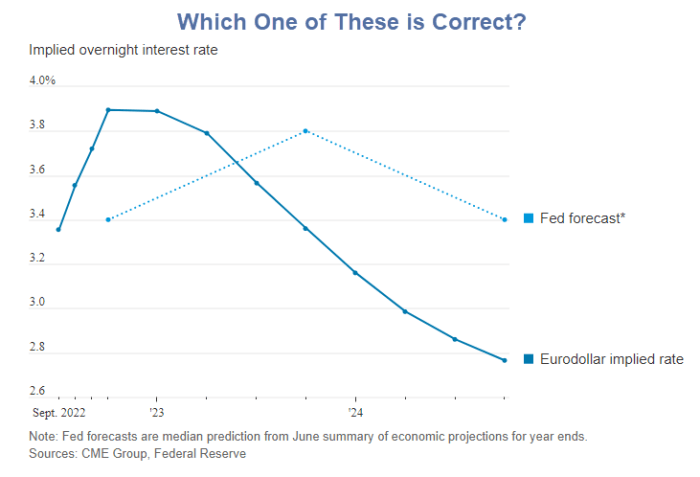
Data from CME and Fed via Wall Street Journal.
Eurodollar Curve
The eurodollar curve has nothing to do with euros or dollars. Rather it is an interest rate curve and one of the world's most widely traded futures.
After peaking at about 3.9% this year, eurodollar betters believe the Fed will then cut rates all the way down to 2.8%.
Five Not-Quite-Impossible Things the Market Believes
Wall Street Journal Contributor James Macintosh discussed the above chart in Five Not-Quite-Impossible Things the Market Believes
- Inflation is transitory.
- The Fed realizes this in time.
- The jobs market cools enough to slow wage rises.
- But not so much it means falling household spending.
- So consumer spending rises in real terms.
In reference to the led chart, Macintosh says "The first assumption is the hardest to believe."
I disagree. The hardest thing to believe is the overall goldilocks scenario and that the current rally makes any sense at all.
Inflation may easily come down if the Fed tightens too much too fast causing a severe recession. What would that do to corporate profits?
But assume otherwise, that inflation does not come down more. What would that do to corporate profits?
While any of the first three points may easily be correct, the combination of all five being correct and that stocks will rise in a goldilocks scenario is what I find hard to believe.
Is the Market Forward Looking?
Goldilocks proponents will tell you that the market is forward looking.
The market isn't forward looking and never was. It is a coincident indicator of current sentiment, wildly wrong at major turns.
If the market was forward looking, what precisely was it looking forward to at the November 2007 peak with recession starting the next month?
What was it looking forward to at the 1929 peak, the 1933 bottom, the 2009 bottom or any other top or bottom?
The Fed Will Hike Until It Breaks Something
I believe the eurodollar curve is more likely to be correct than the Fed. When has the Fed gotten much of anything correct?
The eurodollar view has two ways to win. The first is the Fed actually does tame inflation to the degree that it wants.
That's possible in a severe enough recession. And the global picture is easily weak enough for that to happen.
The second way the eurodollar curve might be correct is if the Fed breaks the credit market.
The Fed would immediately reverse course, regardless of inflation, should that happen.
Neither a credit event nor strong recession would be good for the stock market.
The least likely thing is that the Fed achieves a goldilocks soft landing. Yet, assume that happens.
Macintosh says, and I agree, "The bull case that stocks and corporate bonds are pricing requires the combination of low joblessness and wage rises to allow spending to rise faster than inflation even after pandemic savings run out. But not so much faster that it hits capacity constraints and accelerates inflation."
The problem with goldilocks is stocks are priced so much beyond perfection that they may decline anyway.
Globally Speaking
- China Does Surprise Rate Cut to Help Its Economy, But It Won't Work
- German Costs to Ship by Barge are up Twenty Times and May Soon Be Impossible
- UK Average Electricity Cost Will Soar to $5,370 Per Year By 2023
- US Industries Are Buckling Under Pressure of Surging Electricity Costs
Good luck with goldilocks, especially with the Fed still hiking.
Author

Mike “Mish” Shedlock's
Sitka Pacific Capital Management,Llc


