Wheat (ZW_F) bounced higher from blue box

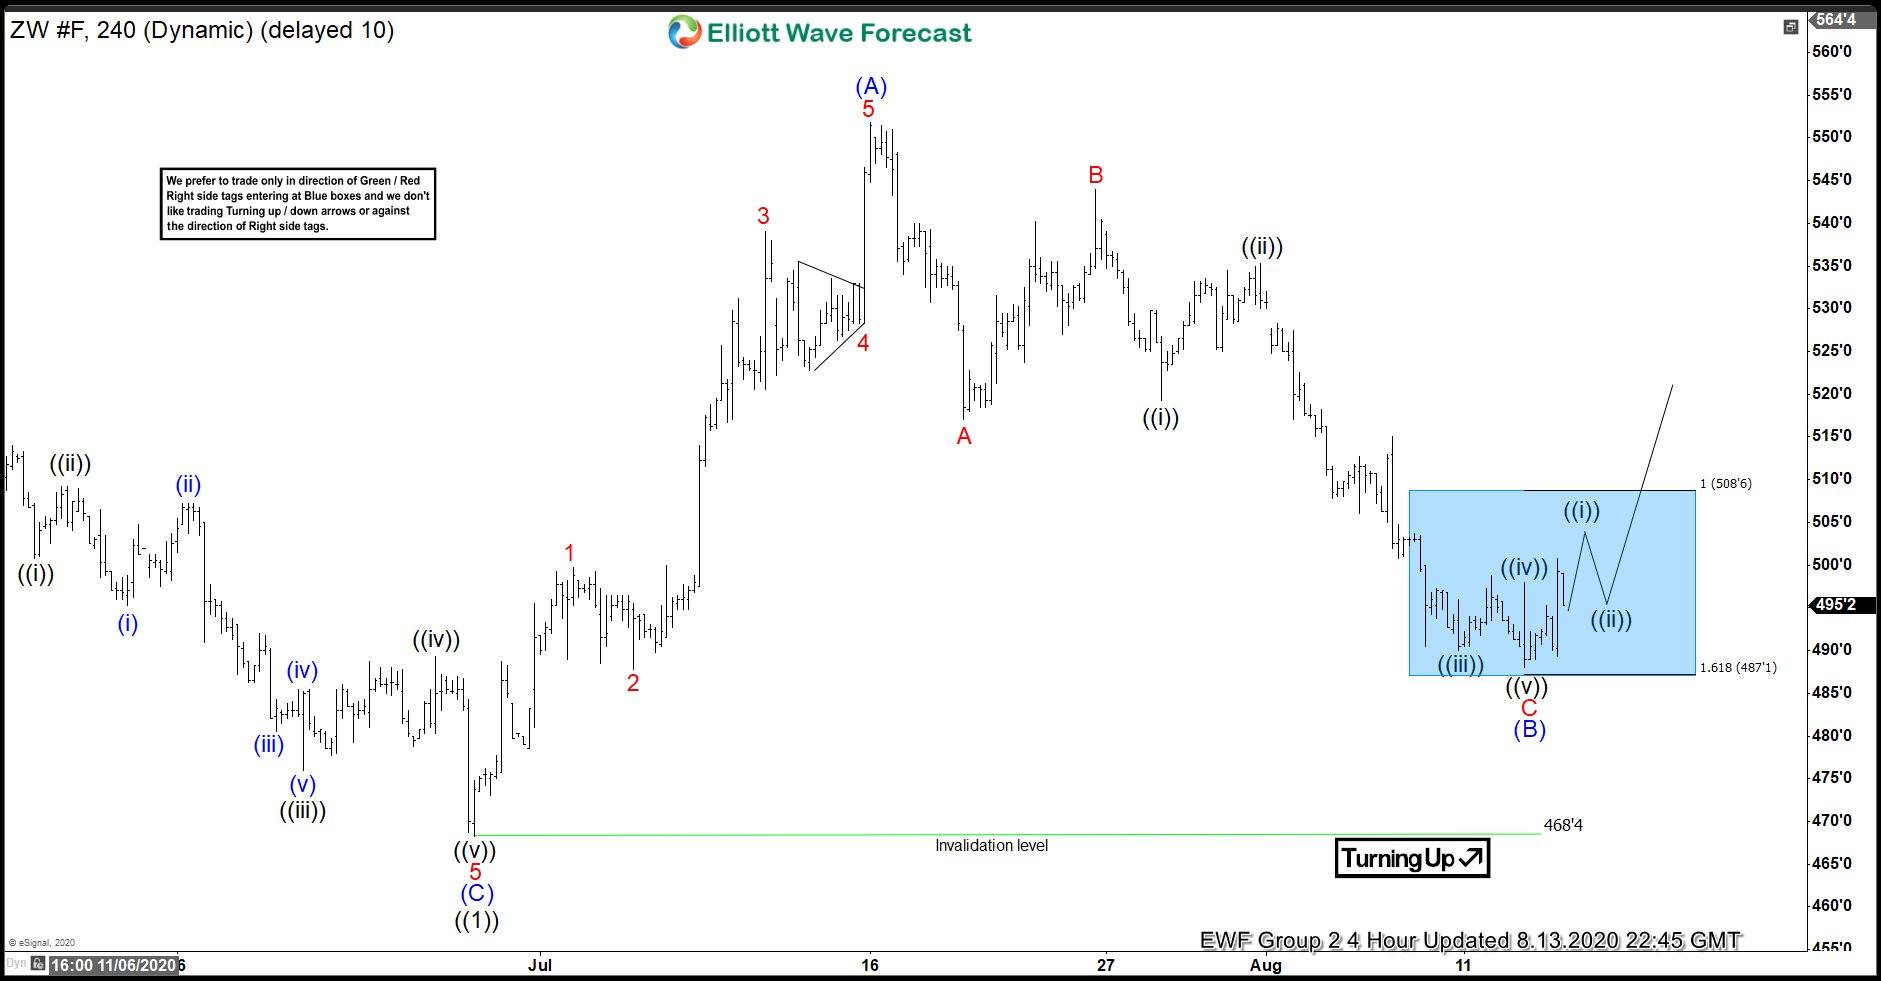
In this blog, we are going to take a look at the Elliott Wave chart of Wheat Futures (ZW_F). The 4 hour chart update from August 13 shows that wheat has ended the cycle from June 27 low as wave (A) at 551.6 high. The sub-waves of the rally unfolded as 5 waves impulsive structure. Up from June 27 low, wave 1 ended at 499.6 high and wave 2 dip ended at 487.6 low. The commodity then resumed higher in wave 3, which ended at 539 high. Wave 4 pullback unfolded as a triangle and ended at 528.2 low. The push higher in wave 5 ended at 551.6 high and also ended wave (A) in the higher degree.
Elliott Wave theory dictates that 3 waves pullback should happen afterwards before the rally continues. Wheat then did a pullback in wave B, which unfolded as a zigzag correction. Down from wave (A) high, wave A ended at 517 low. The bounce in wave B ended at 544 high. The commodity then declined lower in wave C, which ended at 487.6 low. This also ended wave (B) in higher degree. The pullback reached the 100-161.8% extension of wave A-B. That area is highlighted with a blue box. As long as 161.8% extension stays intact, wheat is expected to see 3 waves bounce at least or resume the rally higher from blue box.
ZW_F 8.13.2020 4 Hour Elliott Wave Chart
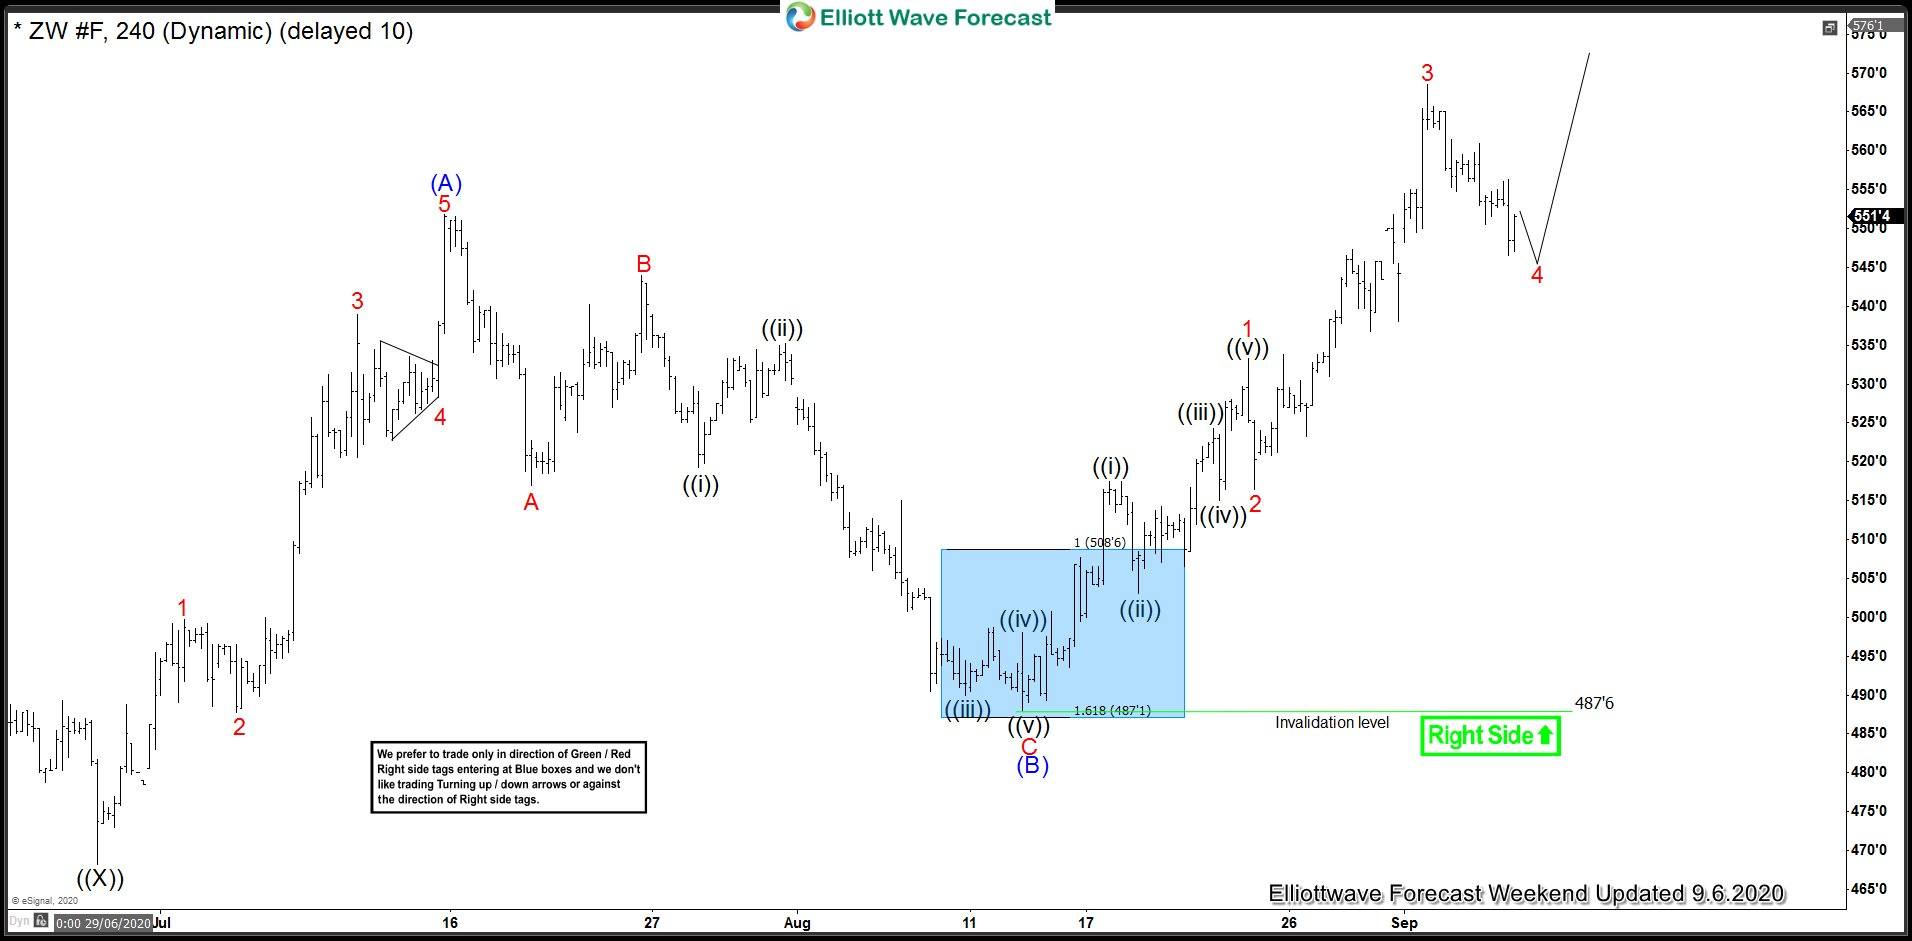
The 4 hour chart update from September 6 shows that wheat resumed the rally higher from the blue box area. The rally broke above previous wave (A) high, confirming that wave (B) is in place and the next leg higher in wave (C) is already in progress. The commodity can see another high within wave 5 to end the rally in wave (C), while staying above 487.6 low. However, wheat currently has already reached the minimum target to the upside, which is 100% extension of wave 1-2 at 562 level.
ZW_F 9.6.2020 4 Hour Elliott Wave Chart
Author

Elliott Wave Forecast Team
ElliottWave-Forecast.com


