What’s your trade ahead of the Fed? Wooden opportunity?
US equity markets sold off a bit in Tuesday’s session ahead of today’s FOMC statement. What is your plan?
Major US equity indices traded lower ahead of the Fed meeting, and the debate over growth versus value stocks continues. Is there any magic language or policy stance that can come out of today’s Fed meeting to provide clarity in this market?
PPI data came out stronger than expected yesterday. This data adds more fuel to the inflationary theme, while Retail Sales were weak. The markets should have been lower from this data, and they were, albeit slightly.
As the anticipation builds to today’s FOMC statement at 2:00 PM ET today and the subsequent press conference at 2:30 PM ET, it seems like a good time to revisit a market that we are following - lumber .
If you have been following along and read the June 9th publication , you know that we are eyeballing the lumber markets for an ETF trade possibility. While the lumber market has been just insane to the upside in 2021, it has recently pulled back substantially. The question remains: are these higher lumber prices sustainable? If so, is there a way to participate via an ETF?
While this may seem like an obscure sector or at least an underappreciated one, let’s take a look at the front-month lumber futures to get caught up on the most recent price action.
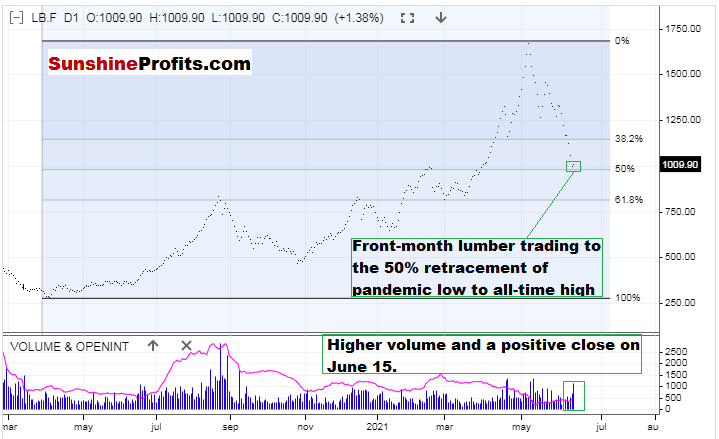
Figure 1 - Random Length Lumber Futures Continuous Contract February 21, 2020 - June 15, 2021 Daily Source stooq.com
Front-month lumber futures made a pandemic low of 251.50 on April 1, 2020. Its recent and all-time high is 1733.30, which was put in on May 10, 2021. Taking a 50% retracement of this move, we have a value of 992.40. Yesterday’s low in front-month lumber futures was 943.70 and a close of 1009.90. Yesterday’s trading was also on higher than average volume. It is important to note that it traded below the psychologically important level of 1000, through the 50% Fibonacci retracement, and then reversed intraday and closed higher. This kind of price action really gets me going.
Let’s also illustrate this price action described above via weekly candlesticks:
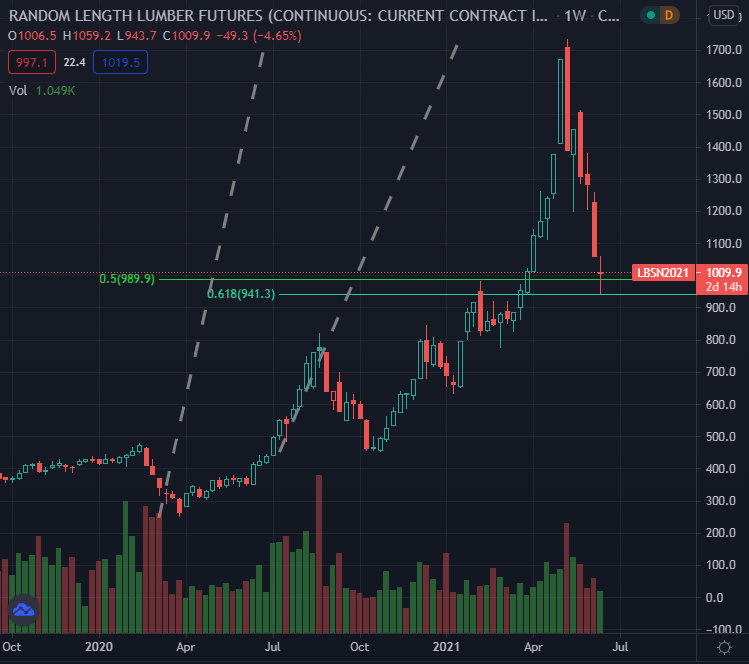
Figure 2 - LBS1! Random Length Lumber Futures Continuous Contract September 2019 - June 2021 Weekly Candles Source tradingview.com
Isn’t that something? I wanted to illustrate this via the weekly candlesticks to add a little more clarity. The weekly candlestick that is being formed this week could be a sign of things to come. Now before we go any further:
I strongly suggest against trading in Lumber Futures. They can be illiquid, and experience many limit up and limit down days. You could be stuck in a losing position and not be able to get out. The only traders in Lumber futures should be hedgers that are in the wood business or deep pocket institutional traders that have real money to burn. Futures trading entails unlimited risk. I am sure that many fortunes have been made, and many more have been lost during this insane lumber market. Being on the wrong side of a futures market like Lumber can be brutal.
Lumber is a very thin contract and may only trade a few hundred contracts per day. But with such intriguing technicals, I want to circle back to an ETF that we covered in the June 9th publication : WOOD iShares Global Timber & Forestry ETF.
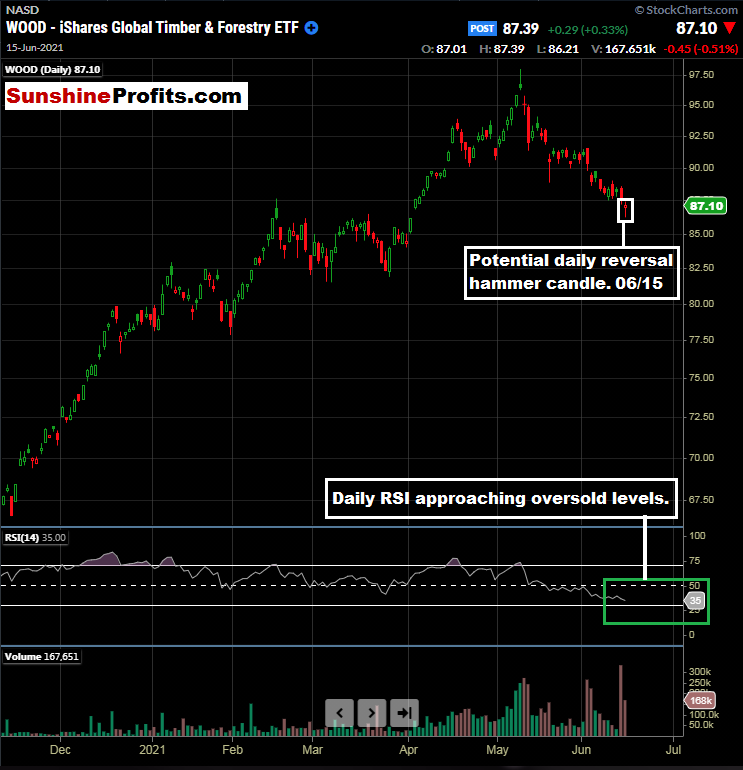
Figure 3 - iShares Global Timber & Forestry ETF (WOOD) Daily Candles November 10, 2020 - June 15, 2021. Source stockcharts.com
So, we see some interesting potential weekly candlestick formation in the Lumber futures and an interesting daily candle in WOOD. While the 2 instruments do not trade a perfect or near-perfect correlation, a correlation exists.
I like the idea of getting long the WOOD ETF based on the action in the Lumber futures markets.
While trying to catch a falling knife can be a precarious proposition, I view this as buying a pullback in a bull market. While we discussed certain levels in the June 9th publication , I would like to explore some different levels and a potential scaling/tranche entry strategy today.
And, while the price of gold certainly hasn’t caught an inflation bid (at least not yet), this could be a wooden opportunity. Maybe a wooden opportunity is the new golden opportunity.
Want free follow-ups to the above article and details not available to 99%+ investors? Sign up to our free newsletter today!
Author

Rafael Zorabedian
Sunshine Profits
After spending years as an active trader across several capital markets, Rafael earned his stripes as a former futures and options broker specializing in equity indices, energies, metals, and soft commodities.


