What Tech Unicorn IPOs Tell Us About Our Humanity

2019 has turned into the Year of Tech IPOs. Lyft. Pinterest. Zoom. Uber. Fiverr. Slack. And we’re only half way through the year. Airbnb, Palantir, Robinhood, and several others have plans to go public before year’s end.
Some of these fresh listings have been bad (ahem… Uber). Others have shot to the moon (like Slack). Like any IPO, it’s a crapshoot which way things will go, a point that is especially true with all these new tech listings because their products are so… well… nebulous. There is a much more “scientific” way to hunt for your fortunes in the stock market, as Rodney has shown.
Keeping Up With The Radical Innovators
I monitor all of these tech developments as they relate to my 45-year Innovation Cycle (and it’s double, the 90-year Bubble Buster). And, as I’ve learned, the most unique talent in the world, economically speaking, comes down to the “radical innovators.” That’s the tiny percent of people who start new S-Curves… that then get improved and adopted in a predictable progression by the rest of society, and ultimately the world.
These are the people that think out of the box and take the greatest risk early on. They also experience the greatest failure rate. But they must take that risk: no new S-Curves means no longer-term innovation… which means no human progress.
The distinguishing intelligence of human beings over the next most intelligent mammal is our limitation of successful behavior. We’re very good at adopting and improving once someone creates “the next cool or big thing.”
A scientific experiment showed how even chimpanzees will observe another experimenting with opening a closed jar to get a banana out of it… but they don’t learn from watching that behavior. When it’s their turn to open that jar, they start from the beginning, like they never saw another chimp just go through the same motions.
That’s clearly not the case with human beings. Once someone invents something cool, or useful, or profitable, we’re quick to imitate and improve on it. But it has to start with those early radical innovators that truly create something new and different.
The S-Curve reflects this imitation and progressive adoption that has made us so successful as a species. It takes as long to go from the 0.1% adoption to 1% as it does from 1% to 10%. It takes the same time to get from 10% to 90% as it did to just get to 10%. That’s the “tipping point” or acceleration phase, when new innovations go mainstream and have the biggest impact on growth, income, and productivity… but not on wealth.
The Early Bird Gets The Wealth
Today in the U.S., the top 0.1% garners 20% of the wealth, the top 1% holds 40%, and the top 10% holds 80%. In short, the early bird gets the worm.
Most wealth isn’t inherited. It’s earned by the most innovative among us who that start new companies and technologies.
The U.S. and Canada also clearly lead the world in such innovation. Look at this chart:
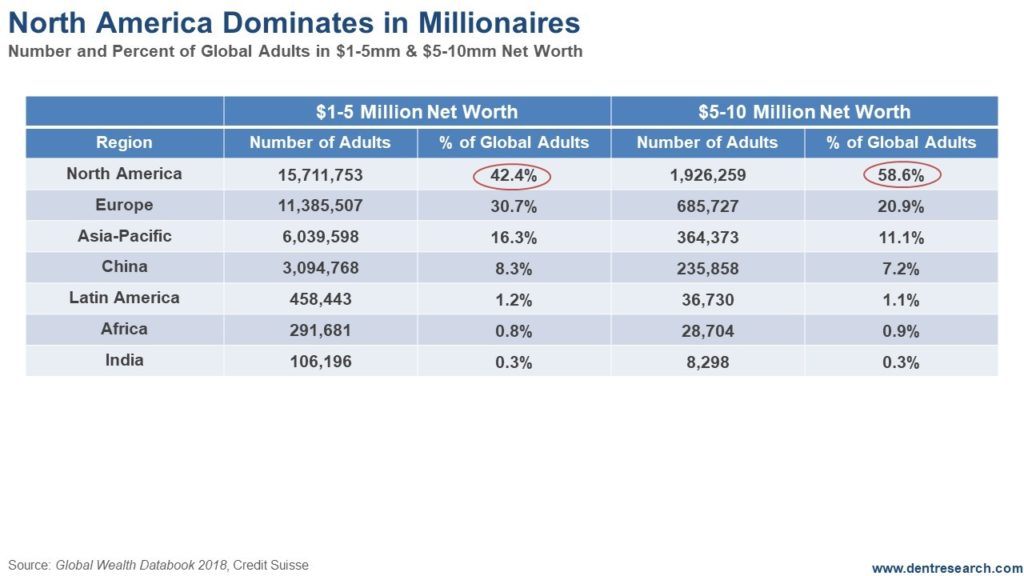
Of the 37.1 million globally that are worth $1 million to $5 million, North America has 15.7 million or 42.4%. Just three years ago, it was 48.0%. Europe is a distant second, with 30.7%.
Mighty China, with its population that dwarfs both Europe and the U.S. is a mere 8.3%, is up from 3.0% three years ago.
Of the ultra-rich, those with $5 million to $10 million net worth, North America has a whopping 58.6% compared to Europe’s mere 20.9% and China’s 7.2%.
We may be regarded as a bunch of rich rednecks with little class by much of the developed world, but this is why I like this country. I am an entrepreneur, and there couldn’t be a better place to be that!
Finally, look at this broader chart.
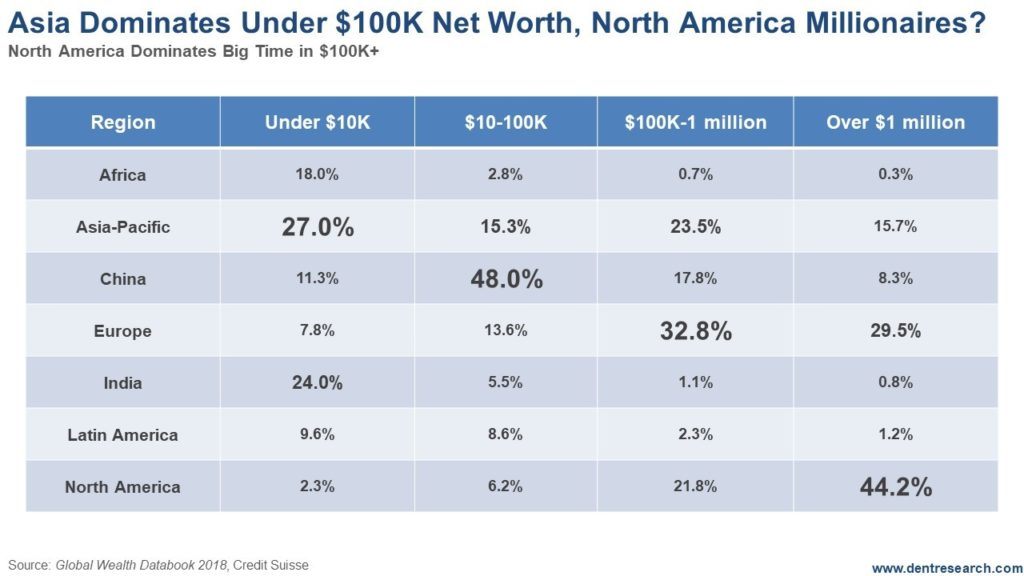
Here we again see the clear dominance of North America in millionaire-plus net worth. Europe dominates the next tier of $100,000 to $1 million, China the next, from $10,000 to $100,ooo, and the broader Asia-Pacific and India dominate the smallest tier.
The fastest growth sectors will obviously be the smaller ones, dominated by Asia.
The Million-Dollar Questions…
The million-dollar question is: how long can the U.S. and Canada dominate innovation and wealth given our slowing demographics? I say not nearly as much after the next global boom peaking in 2036-37.
Another is, as China’s urbanization and demographic trends slow, and India’s accelerate, who will see the greatest growth in wealth in the decades ahead? China is clearly in the second spot and likely to move to #1 a decade or two from now after a devastating fall from grace ahead. But, by watching India’s slow, yet steady and more productive urbanization progress, I see it very likely passing China in the second half of this century. And they’re the next big thing globally after this crash and great reset ahead!
Far too many economists will miss this critical trend because they’re “closet extrapolators.” We’re not. We won’t miss it. Nor will you if you keep reading.
Author

Harry S. Dent, MBA
Dent Research
Harry S. Dent Jr. studied economics in college in the ’70s, but found it vague and inconclusive. He became so disillusioned by the state of his chosen profession that he turned his back on it.


