What happens to Gold if the USDX keeps “bottoming”?

The USD Index is bottoming – check.
It moved to a super-strong combination of long-term support levels – double check.
The USDX declined after Trump’s comments just like it had declined in early 2018 after Mnuchin’s comments (which led to a major bottom) – triple check.
But does it mean that the USD Index is done bottoming?
No.
It could simply trade sideways for a while before soaring. In fact, there is a specific 3-4 year cycle in the USD Index that supports this scenario.
Let’s take a closer look.
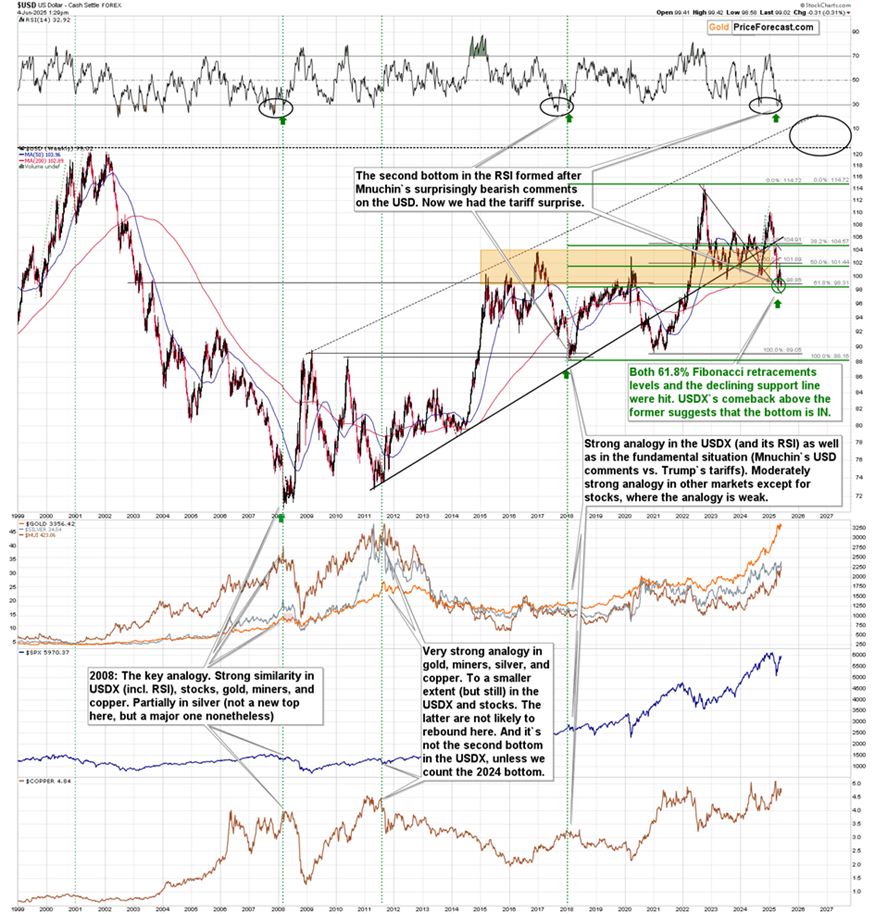
Since the 2005 bottom (yes), the USD Index has been forming major bottoms every 3-4 years:
- 2005
- 2008 (three years later)
- 2011 (three years later)
- 2014 (three years later)
- 2018 (four years later)
- 2021 (three years later)
- (most likely) 2025 (it’s four years after the previous bottom)
Interestingly, in all those cases (except for the current one, as the jury is still out here), it took a while for the money to flow to the USD and for the bottoms to form.
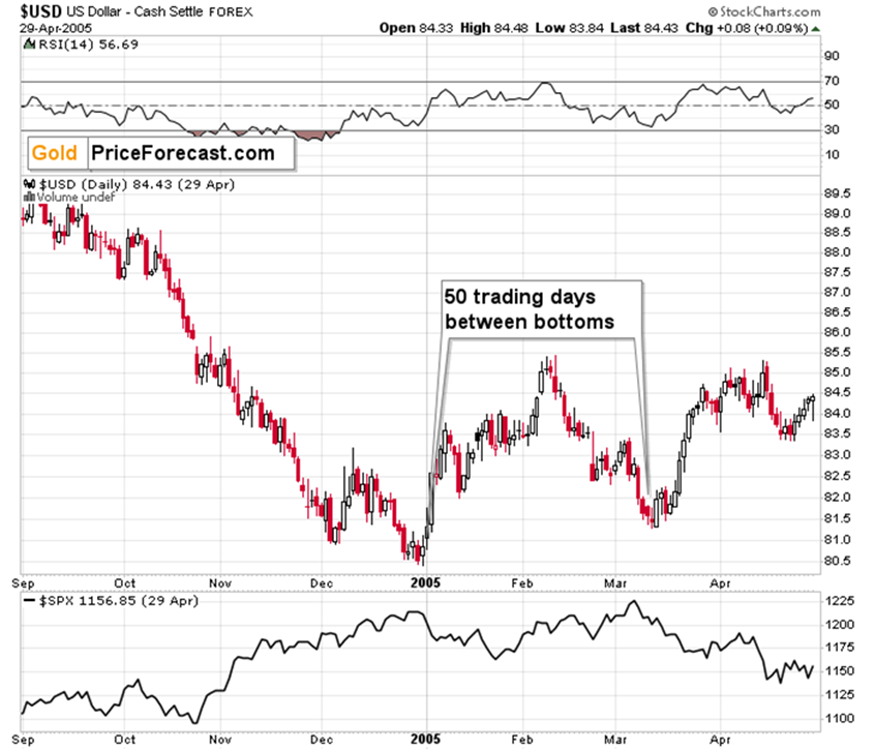
In 2005, the bottoms were 50 trading days apart.
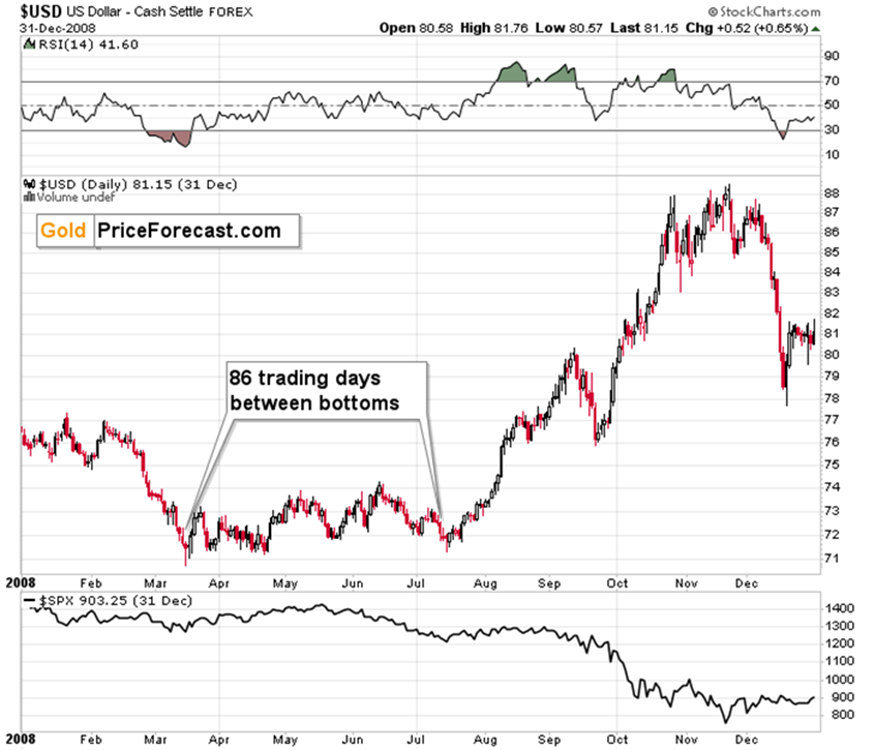
In 2008, the bottoms were 86 trading days apart.
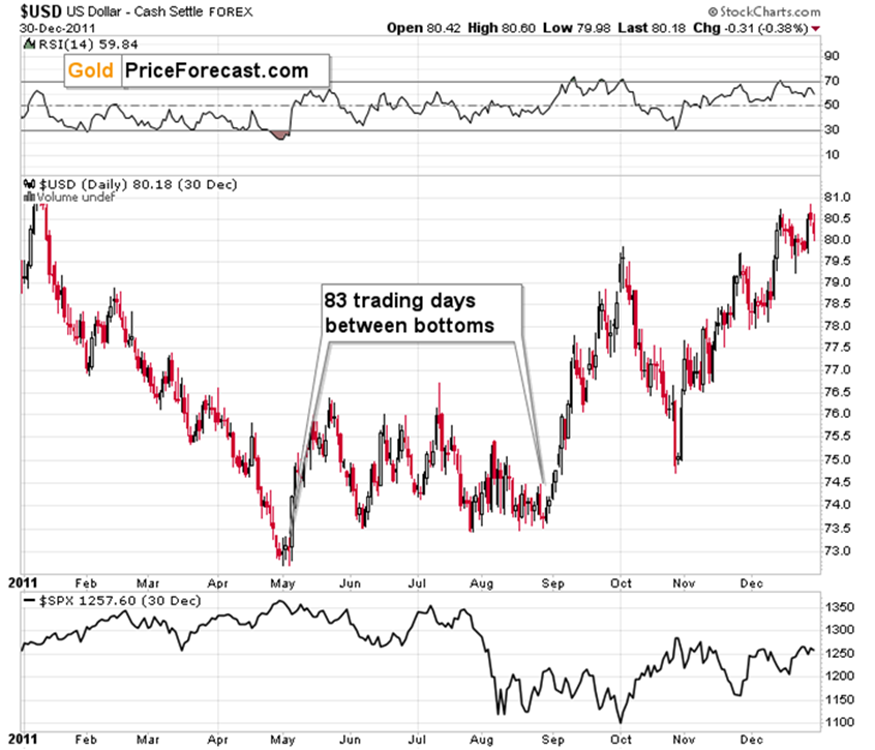
In 2011, the bottoms were 83 trading days apart.
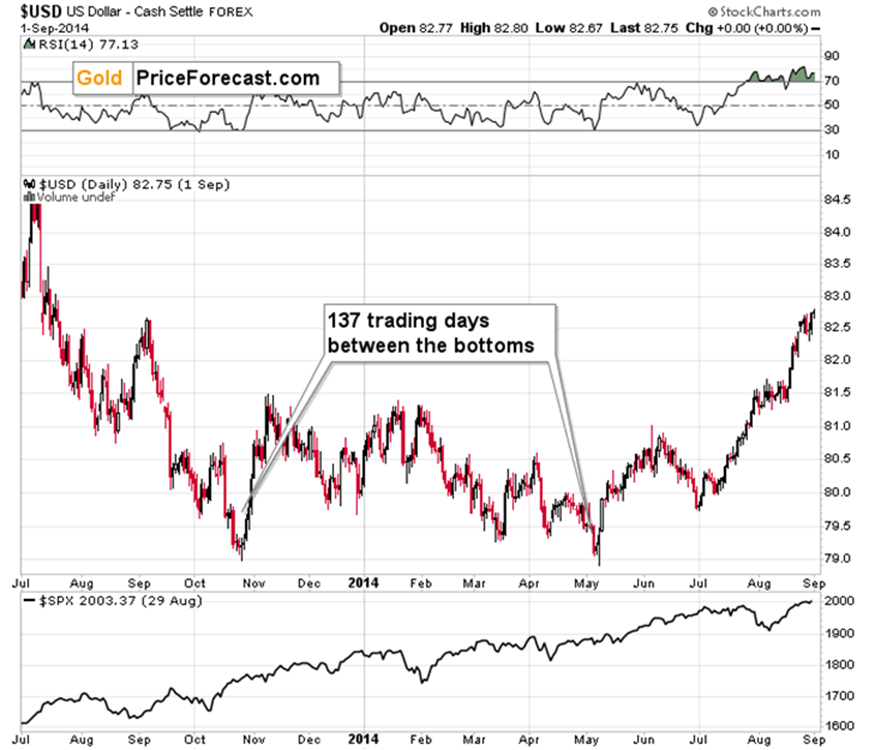
In 2014, the bottoms were 137 trading days apart.
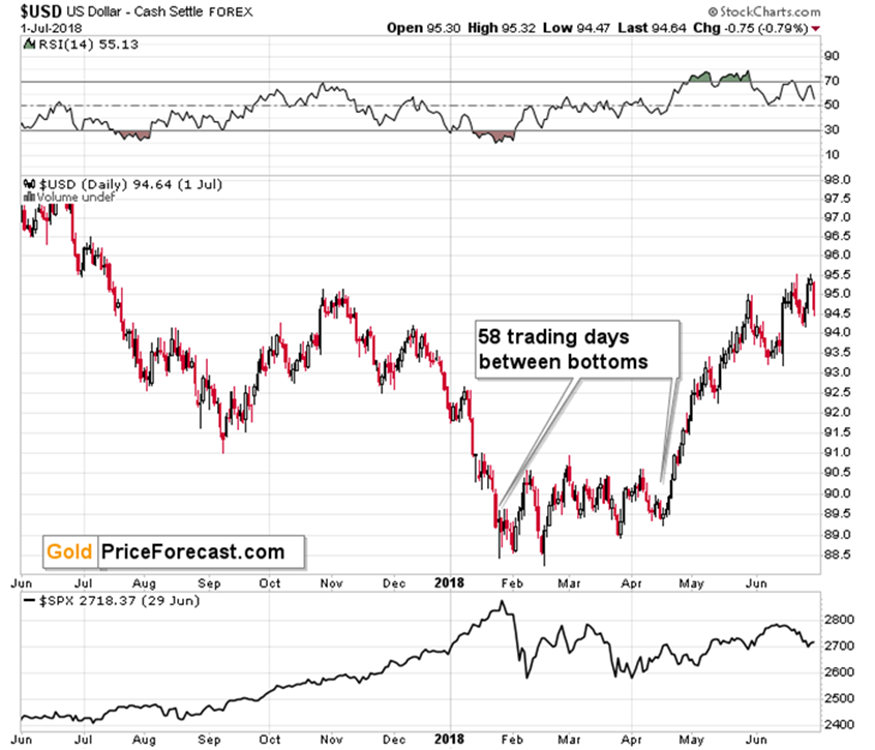
In 2018, the bottoms were 58 trading days apart.
This means that the 50-something trading day bottoms are normal, and so are the 80-something trading day bottoms. The 137 one or ones much shorter than 50 could be viewed as an anomaly.
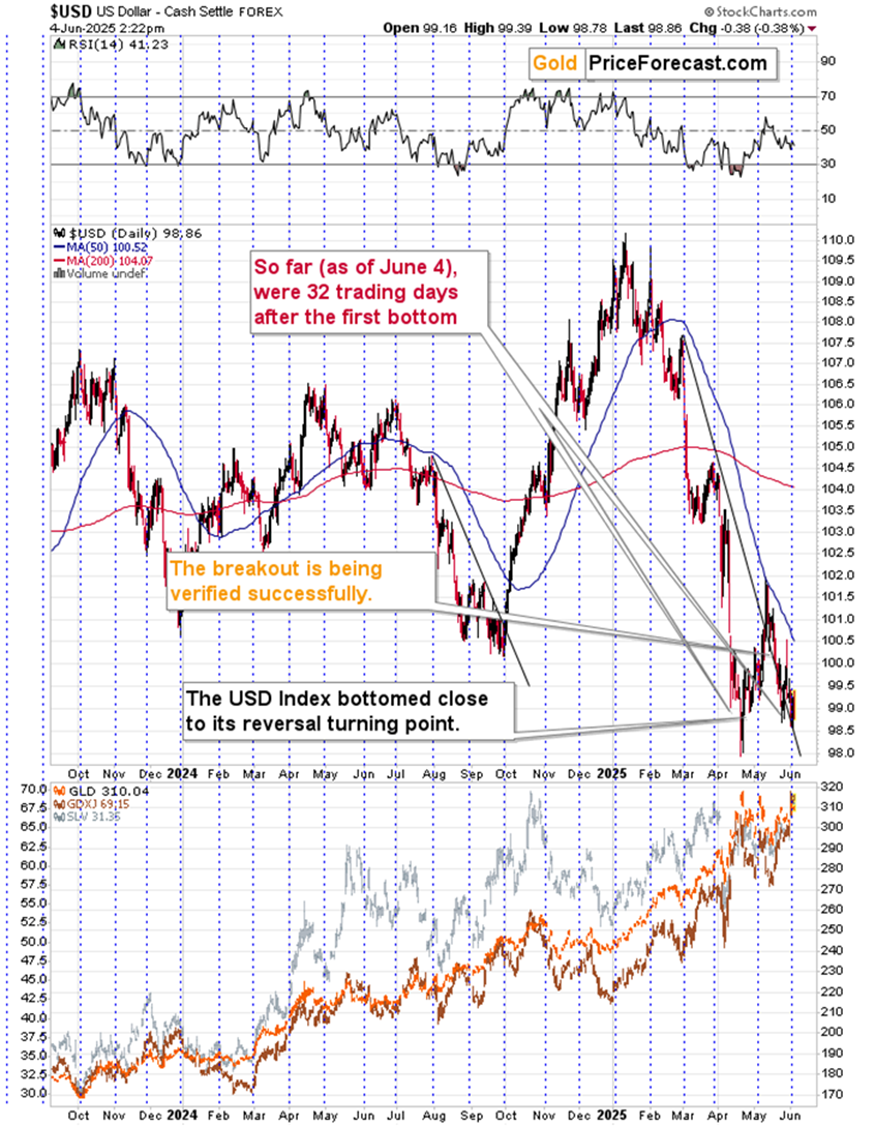
Right now, we’re 32 days after the first bottom. This is a much shorter period than in all previous cases. This, in turn, means that even if the USD Index is likely to rally from the current levels (and this very much IS the case – I view this as very likely), It might take another 18-28 trading days before the second bottom forms – this would be in perfect tune with historical norms.
USDX pauses, but the uptrend remains intact
A rally that starts later than that would also be in tune with the above but given the current geopolitical situation (tariffs are fundamentally positive for the USDX) and the stock market turmoil could start any day (which historically led to USD’s strengthening) it seems that we won’t have to wait too long for the USD Index’s rally. That’s why I’m leaning toward the analogies to narrower (if one could call a 2-month bottoming process that) bottoms.
All this means that the USD Index could easily keep its super-bullish medium-term potential and still do nothing (trading sideways) for the rest of this month.
That’s what it’s doing today – moving back and forth again. The volatility is high in intraday terms, but low in in medium terms of weeks.
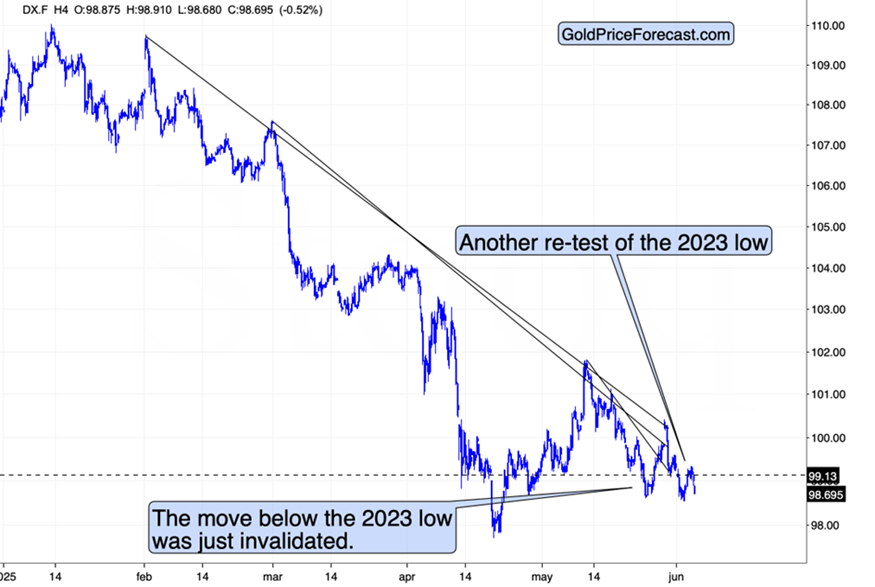
The USD Index once again moved below its 2023 low, and just like was the case previously, it’s likely to invalidate this move lower as well.
As the USD Index moved lower today, gold moved higher.
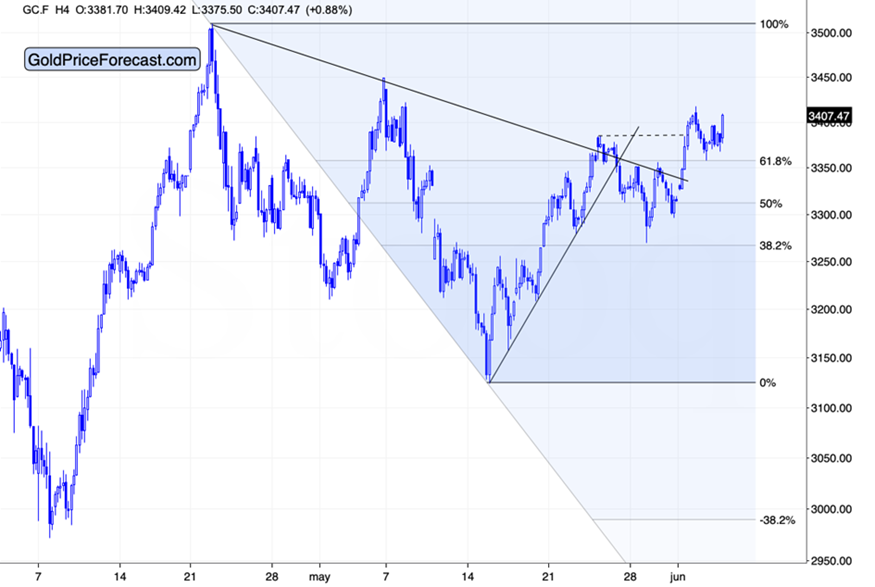
The breakout above the 61.8% Fibonacci retracement was successfully verified yesterday, so we could see another attempt to rally to $3,450 or perhaps even $3,500.
Mining stocks signal bullish continuation
And while this may not result in strong gains in silver (due to reasons that I’m outlining in today’s Gold Trading Alert), gold stocks could rally once again.
Getting back to the USD Index’s back-and-forth movement, it might be tempting to view this as discouraging or boring, but I actually view it as informative. It allows us to monitor how gold and mining stocks react to this movement. Are they magnifying the USD’s bearish signals or the bullish ones? The current indication is bullish – the back-and-forth in the USDX triggers gains in the miners, which are strong relative to gold.
When we see signals of weakness – and I’m staying alert – we’ll know that it’s time to take profits from the mining stocks that we have long positions in, but for now, it seems that they can rally further. In particular, one company that rallied has such an extraordinary technical setup that it’s difficult not to get excited about it. Broken above key resistance, verified the breakout, and it’s very strong compared to GDX on a relative basis. It could rally even if the USDX does the same. And while it rallied right after we entered long positions in it, it looks like it could soar by another 25% (unleveraged!) before hitting our profit-take level – and while I can’t make any promises, this could happen as early as this month.
Also, another company that is most likely about to confirm its long-term breakout today, greatly improving its technical picture, and likely resulting in a powerful rally (bigger than in GDX or GDXJ).
Want free follow-ups to the above article and details not available to 99%+ investors? Sign up to our free newsletter today!
Want free follow-ups to the above article and details not available to 99%+ investors? Sign up to our free newsletter today!
Author

Przemyslaw Radomski, CFA
Sunshine Profits
Przemyslaw Radomski, CFA (PR) is a precious metals investor and analyst who takes advantage of the emotionality on the markets, and invites you to do the same. His company, Sunshine Profits, publishes analytical software that any


