What can gold bugs learn from the latest world gold council report?

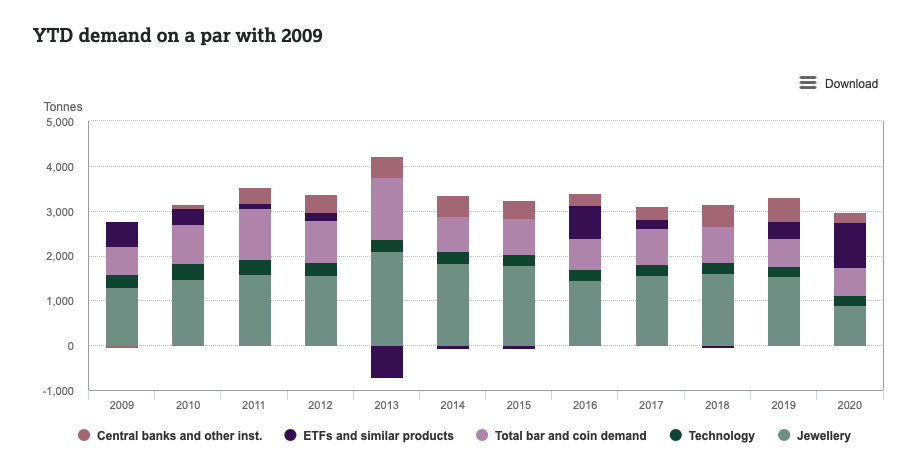
Year to date demand for gold is approximately equal to 2009 demand .The year to date demand is around 2,972 tonnes. Take a look at the year to date demand chart for gold to compare it to other years with a breakdown of the major parts to this demand: Gold backed ETF’s, bars and coins, and jewellery demand etc.
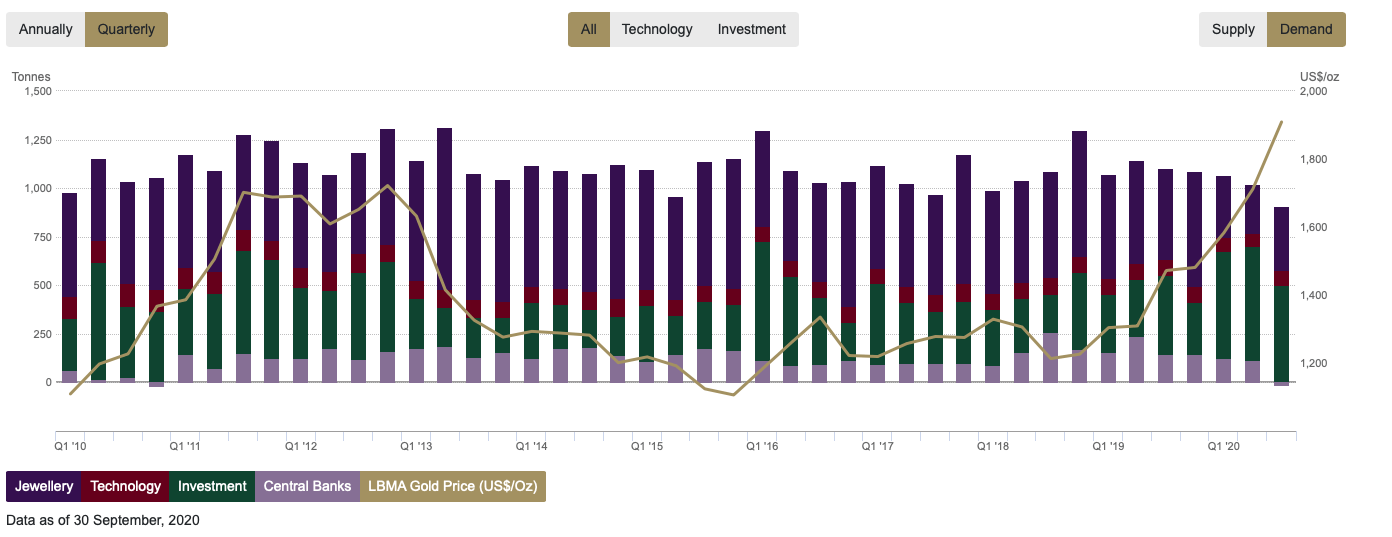
Recent demand has been slowing as spot prices hit high levels in Q3. The quarter on quarter demand for Q3 fell to 892.3 tonnes. This is the lowest since Q3 2009:
World Gold Council’s key findings
1. Jewellery demand has improved from the Q2 record low. Most markets have seen some kind of recovery as lockdown restrictions lifted across the world. Some sellers have reported a shift to online shopping helping demand recover. The drop in jewellery demand was partly due to rising gold prices as well which hit recent peaks in Q3. Read the full report here.
2. Exchange traded funds demand have grown again. Gold backed etf’s achieved 3880 tonnes in Q3 as these investments grew by a further 272.5 tonnes. So, the fall in jewellery demand has been more than compensated for by the rise in ETF holdings.
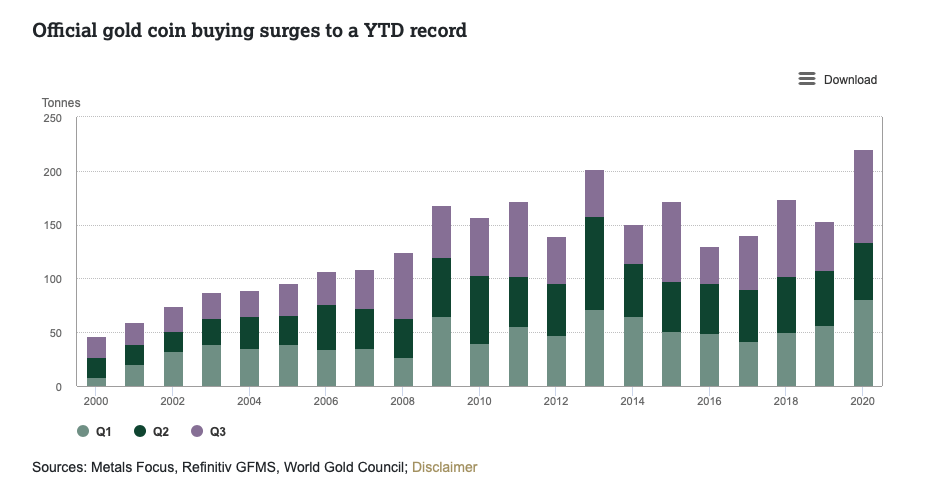
3. Bar and coin demand rockets higher to a YTD record. Q3 bar and coin demand in the US has more than quadrupled year on year yo 19.2 tonnes. The Year to date purchases are 48.9 tonnes more than treble the demand that was in the same period of 2019.
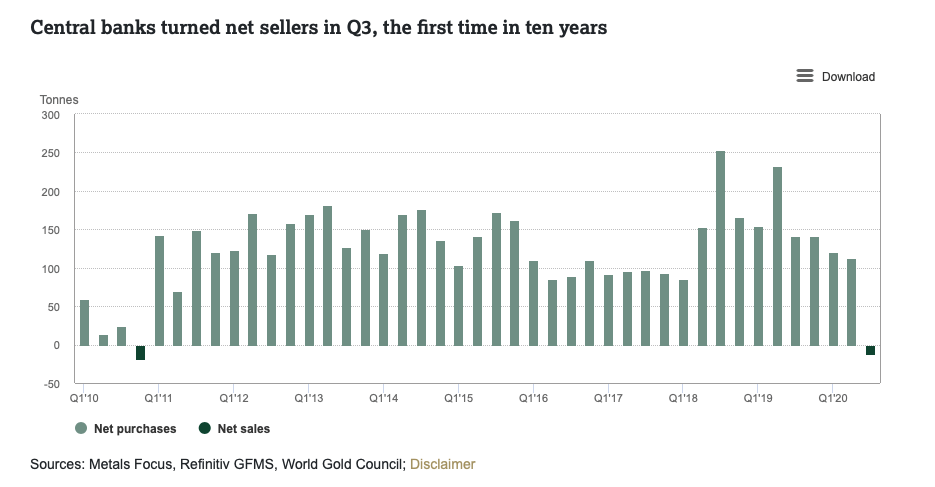
4. Central banks sell. This was mainly due to the fact that Turkey and Uzbekistan sold around 57 tonnes of gold between them. I suppose they are cashing in with the higher prices. Six other central banks increased reserves.
In summary, there is plenty of potential demand still to come in the market. If a COVID-19 vaccine rolls out and that gives consumers enough confidence then the jewellery market should open right up. The growth in bars and coins is encouraging as it means that investors and consumers are looking to accumulate gold. The huge rise in ETF’s shows the fundamental bias for gold bugs is still there as investors accumulate positions.
Author

Giles Coghlan LLB, Lth, MA
Financial Source
Giles is the chief market analyst for Financial Source. His goal is to help you find simple, high-conviction fundamental trade opportunities. He has regular media presentations being featured in National and International Press.


