What are the Real Reasons for Declining Productivity?

Economists debate whether the decline in productivity is real. It is real. let's investigate 10 reasons why.
Productivity Measurement
Brookings questions the Productivity Slump. It cites measurement issues.
Much of the recent debate, and related research, on productivity measurement issues has focused on this decline in productivity in the U.S. Predating the financial crisis and the ensuing Great Recession, and now continuing for more than a decade, the productivity slowdown in the U.S. does not appear to be just cyclical in nature, but rather seems to reflect also deeper, structural phenomena. There are different views on what factors explain the slowdown. But one view challenges the very reality of the slowdown, arguing that the slowdown wholly or largely reflects the failure of the productivity statistics to capture recent productivity gains, particularly those from new and higher-quality ICT goods and services
There are two potentially important sources of underestimation of productivity related to ICT goods and services. First, if prices do not fully capture quality improvements in the new ICT products, price deflators are overestimated and real output (adjusted for improvements in quality, including product variety) is underestimated. Second, many ICT services, in particular internet-based services such as Google searches and Facebook, are largely not reflected in GDP measurement even though they generate substantial utility for consumers, the reason being that their use does not involve monetary cost as they are available free of charge to the users.
Facebook a Productivity Killer
Google searches are indeed a time-saver. But what the hell is "produced" by them. And where do the searches and Facebook playing take place?
At work perhaps. After discussing the above Brookings did come to this conclusion: "In large part, the productivity slowdown—and the associated productivity paradox—are real."
It never explained why. Rather Brookings remains puzzled: "While recent research suggests that mismeasurement, although sizable, does not explain most of the observed decline in productivity, it must be noted that there remain unknowns and gaps in data."
Real or Imagined
The National Bureau of Economic Research (NBER) asks Is the U.S. Productivity Slowdown a Mirage?
Labor productivity in the United States—defined as total output divided by total hours of labor—has been increasing for over a century and continues to increase today. However, its growth rate has fallen. One explanation for this phenomenon focuses on measurement difficulties, in particular the possibility that current tools for measuring economic growth do not fully capture recent advances in the goods and services associated with digital communications technology.
One reason some analysts believe that labor productivity is understated is that price inflation may be overstated for digital goods and services.
As with Brookings, the NBER concludes there is some mismeasurement but fails to figure out why.
As an aside, the NBER group is the official arbiter of recession dates in the US.
Federal Reserve Bank of San Francisco Study
The FRBSF asked the same question: Does Growing Mismeasurement Explain Disappointing Growth?
The FRBSF came to the same conclusion that mismeasurement is a problem but like the others fails to offer credible rationale.
No Hidden Productivity
The problem with the above analysis is the Fed, Brookings, and the NBER all focused on the measurement issue in apparent belief there is some sort of hidden productivity waiting to be discovered.
Mismeasurement Irony
I propose productivity is likely to be overstated, not understated because of mismeasurement.
How so?
- How many overtime hours do supervisory workers at Walmart, Target, etc., actually work while getting paid for 40?
- How many hours do employees work at home and on vacation while not getting paid for them?
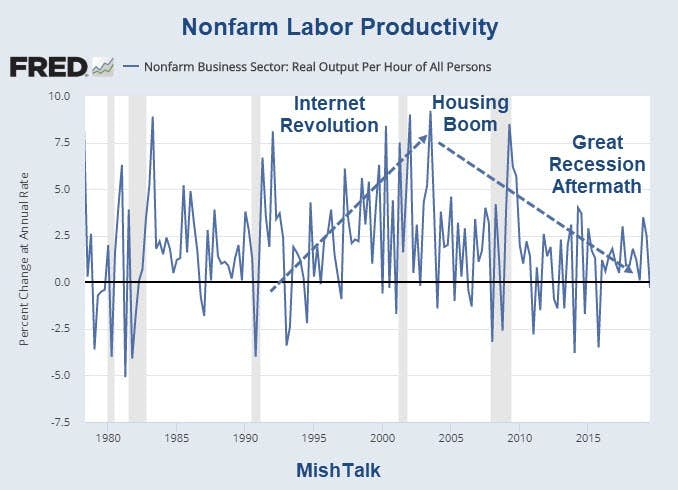
Before diving into a 6-point practical explanation as to why productivity losses are real, please ponder a few charts that I put together.
Nonfarm Productivity 1990-Present
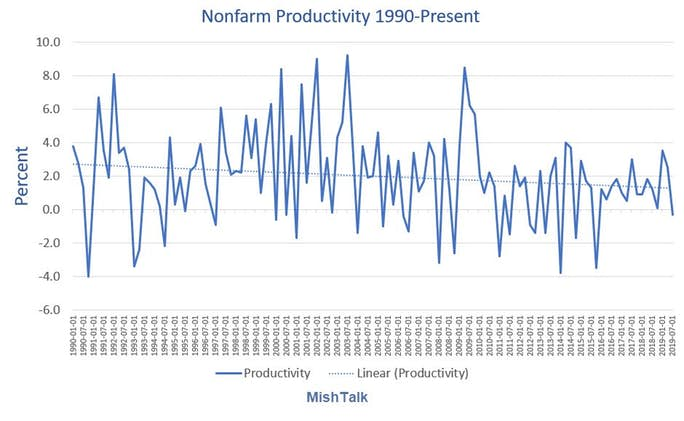
In the above and all the following charts, I let Excel plot the trendline. The chart shows declining productivity, but it's horribly misleading. Let's investigate other timeframes to understand why.
Nonfarm Productivity 1990-2000
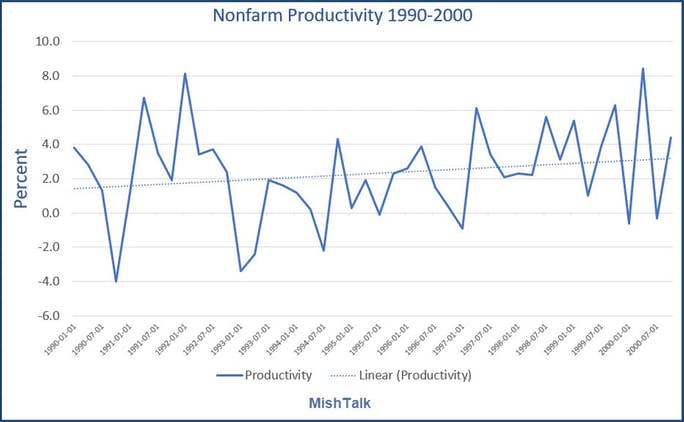
Those are the heydays of the internet revolution. Computers replaced people. Spreadsheets replaced accountants. Robots replaced manufacturing workers at an increased pace.
Nonfarm Productivity 2001-2007
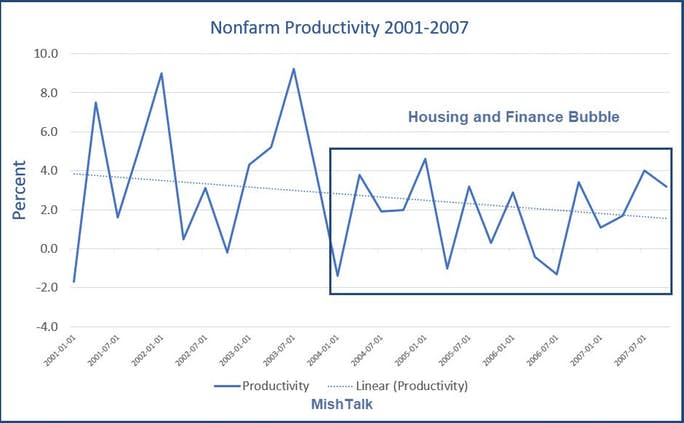
Productivity soared coming out of the dotcom and 911-related recession.
By 2004, economic activity was all about housing and finance.
Nonfarm Productivity 2009-2019
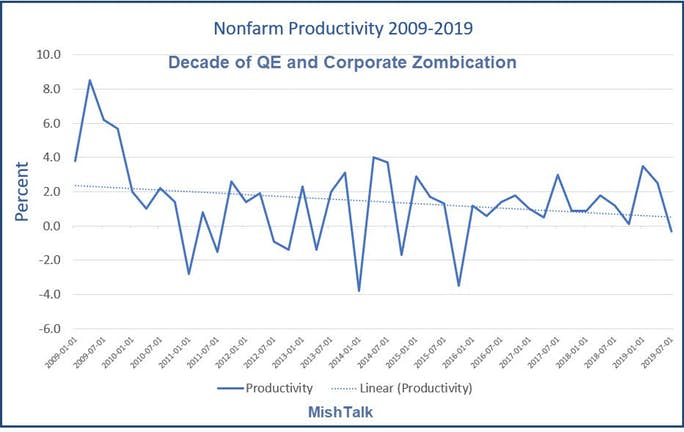
Productivity soared coming out the the Great Recession as is the case coming out of any recession. Since then corporate productivity has been anemic.
Manufacturing Real Output vs Employees
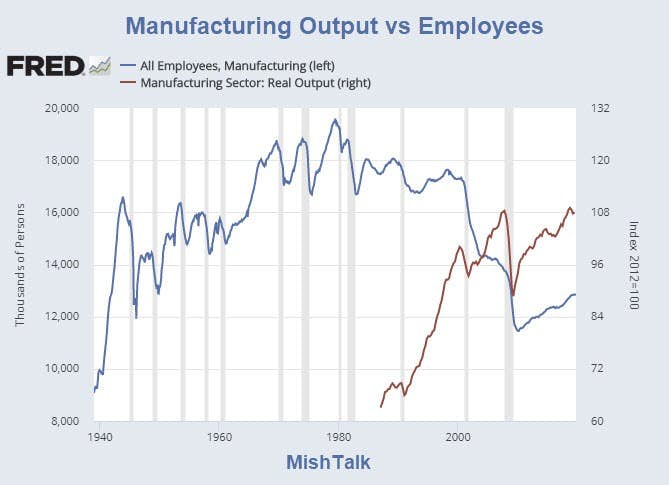
From 1990 until 2008 manufacturing output per employee skyrocketed. Both plunged in the Great Recession and the trends are now positive but output per employee has slowed to a crawl as the number of manufacturing employees has been on the rise.
This indicates decreasing marginal utility of robots, lower worker skill sets, or both.
Obesity Trends
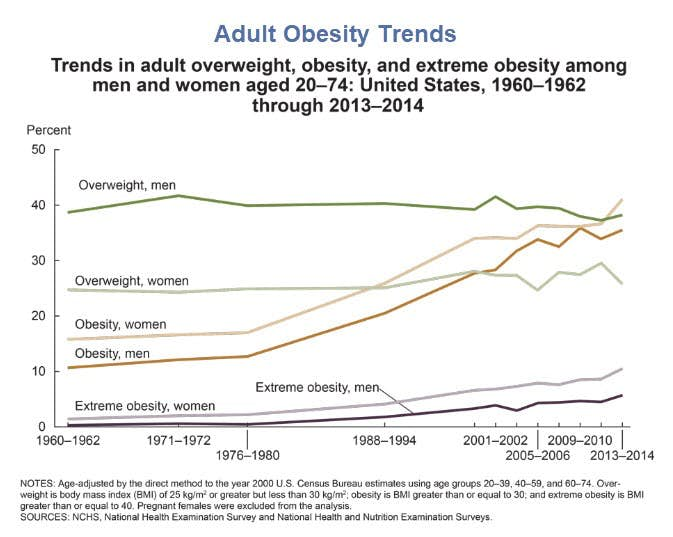
Chart from the National Institute of Health.
Obese workers have more health-related issues and thus need more time off. They also move slower and do not function as well as healthy workers.
Rise of the Zombies
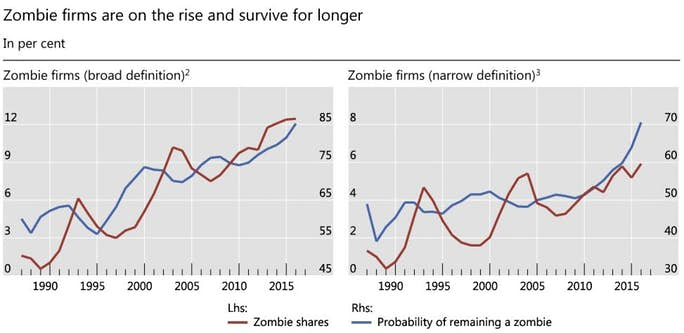
Zombie firms are companies that are unable to cover debt servicing costs from current profits over an extended period. Cheap financing is the primary cause. The result is low productivity.
Please review Rise of the Zombie Corporations: Percentage Keeps Increasing
Collective Bargaining with Militant Unions
On October 31, I asked Chicago ISM Crashes: How Much is GM to Blame?
I do not pretend to have the answer, but GM agreed to a lot of worker protections, guaranteed hours, plant improvements, etc, that will not make any sense if there is an economic slowdown.
Chicago also just settled its teacher strike to which I commented Chicago Headed for Insolvency, Get the Hell Out Now
Chicago Teacher Contract Details
- 16% raise over five years (not including raises based on longevity)
- Three-year freeze on health insurance premiums
- Lower insurance copays
- Caps on class sizes
- More than 450 new social workers and nurses.
- New job protections for substitute teachers who going forward may only be removed after conferring with the union about “performance deficiencies.”
- Chicago Public Schools will become a “sanctuary district,” meaning school officials won’t be allowed to cooperate with the Immigration and Customs Enforcement without a court order.
- Employees will be allowed 10 unpaid days for personal immigration matters.
- Under the new contract, a joint union-school board committee will be convened to “mitigate or eliminate any disproportionate impacts of observations or student growth measures” on teacher evaluations.
- Instead of student performance, teachers will probably be rated on more subjective measures, perhaps congeniality in the lunchroom.
- The new union contract caps the number of charter-school seats, so no new schools will be able to open without others closing.
Points four through 11 are all productivity killers.
Soaring Fiscal Deficits
Government does not spend money wisely to say the least. It collects money via taxes then wastes in on counterproductive military operations and other nonsense.
When it spends on infrastructure, it overpays because of prevailing wage laws and collective bargaining.
For further discussion of the debt vs deficits, please see Budget Deficit Lies: What's the Real Deficit?
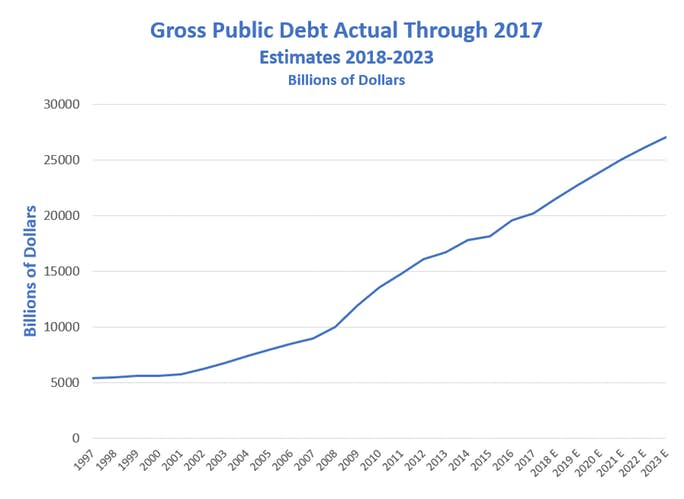
It's the Debt Stupid
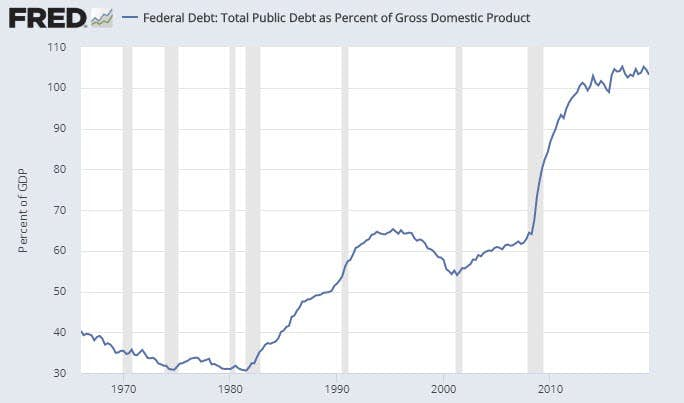
It takes $103 in public debt for a $100 increase in GDP.
Build up public debt, expect lower productivity.
Interest on the National Debt
According to Treasury Direct, Interest on the National Debt is $574 billion.
There is nothing remotely productive about paying interest to banks.
Corporate Buybacks
Trump's tax cuts did not spur investment as claimed. Corporations took the cuts and another repatriation holiday for dividend and buybacks.
In addition to using profits to buy back shares, some companies went further into debt to buy back shares.
If you skimp on investment, don't expect productivity miracles.
Real Productivity Decline, 10 Simple Explanations
- The internet boom and the rising productivity associated with it were very real. The rate of change in internet-related improvements has fallen since 2000.
- Decreasing marginal utility of robots.
- The Fed's easy money policies sponsored numerous corporate zombies. Those zombies survive only because of ultra-easy financing. Zombie companies are unproductive, by definition. Things are even worse in the EU because of negative rates.
- The Fed's easy money policies also sponsored a "store on every corner". There are far more retail stores, restaurants, fast food establishments, and outlet malls than needed.
- Marginal stores have to be manned by somebody and they are, by increasingly marginal employees as the unemployment rate declines.
- Demographics. As skilled workers retire, those workers are replaced by workers with lower skills.
- Health issues in general. Obesity and drug-related issues are on the rise as are time off for those reasons.
- Militant unions demand and receiving unwarranted pay, time off, and control over workplace conditions.
- Corporate buybacks mainly benefit CEOs and executives who cash out their shares and options. It takes careful investment, not reckless expansion, not buybacks to have productivity gains.
- It's the debt, stupid. Fiscal deficits are totally out of control. Interest on the national debt by itself is $574 billion. What are we getting for it?
Looking in the Wrong Place
The San Francisco Fed, Brookings, and the National Bureau of Economic Research all struggle to explain falling productivity.
They can't come up with the answer because they all have a spotlight on mismeasurement (and in the wrong direction at that, failing to count supervisory overtime and hours worked at home).
But there's the answer, in ten easy to understand points, supported by data, logical analysis, and graphs.
By the way, this enormous buildup of debt at every level is hugely deflationary. Bubbles do burst eventually.
Author

Mike “Mish” Shedlock's
Sitka Pacific Capital Management,Llc
Mike “Mish” Shedlock is a registered investment advisor for SitkaPacific Capital Management.


