Wells Fargo WFC Remains Bullish
Wells Fargo (NYSE: WFC) is the world’s second-largest bank by market capitalization and the third largest bank in the U.S. by assets.
Last week, the Bank was fined $185M by the FED for ‘widespread illegal practices’ because of the recent fake accounts scandal and it was banned from growing until it convinces authorities it’s addressing shortcomings.
It’s stock plunged 10% this week, its biggest correction in the recent 2 years & it’s biggest single-day drop since the financial crisis. Analysts at firms including Citi, JPMorgan, Morgan Stanley and RBC already downgraded their ratings for the company and the media is transmitting the message that investors have lost faith in the San Francisco financial giant.
However, if we take a look at the technical chart of WFC, we’ll understand that the reason for the drop was purely a technical move and have nothing to do with the recent news.
WFC Daily Chart 05.02.2017

Since October 2016 low, WFC did a 7 swings double three structure which managed to reach the target around equal legs area $65.67. So technically the move had enough number of swings and it was expected to see at least 3 waves pullback to correct that cycle toward the 50% – 61.8% Fibonacci retracement area $57.65 – $55.61.
We believe that market is ruled by technical analysis and the fundamental news is only used to trigger the move which was exactly what happens with Wells Fergo as the Fed sanctions came after the fact that WFC already reached the technical target. The reaction came from the blue box which is a high-frequency area where the markets are likely to end cycles and make a turns.
What will be the next move for WFC?
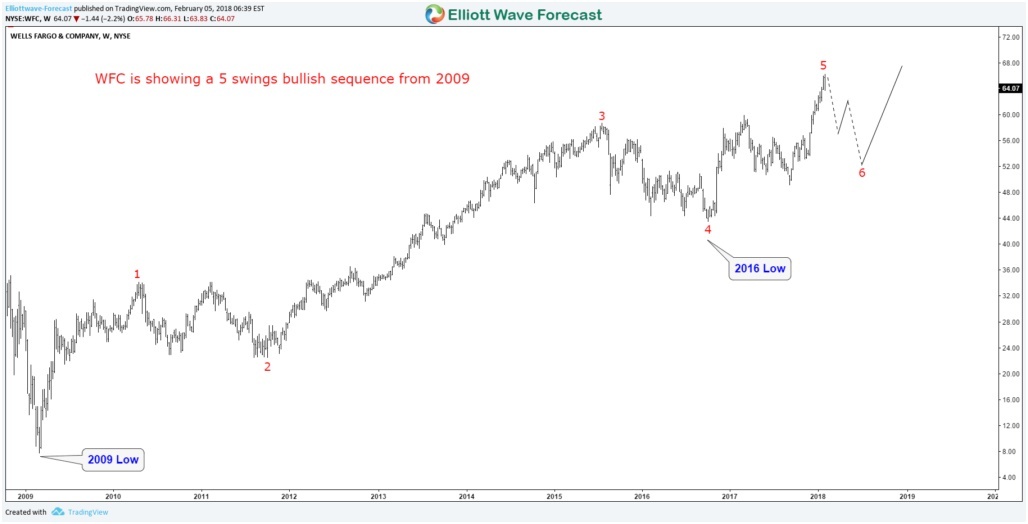
In the above chart, we can see that WFC is showing a bullish 5 swings from the 2009 low, which is different from the regular 5 waves structure. We consider the sequence as incomplete and as long as it remain above the 2016 low then the stock should rally to new highs targeting $94 – $106 area to finish 7 swings move.
Later on, if the stock fails to break to new highs then it can end 2009 cycle as a diagonal 5 waves resulting in a larger correction in 3 waves followed by a new rally.
Consequently, WFC remains bullish despite the recent plunge as the technical picture is still supporting more upside. Currently, it’s only correcting the cycle from 2016 low in 3 , 7 or 11 swings where buyers are expected to show up for 3 waves bounce at least.
Become a Successful Trader and Master Elliott Wave like a Pro. Start your Free 14 Day Trial at - Elliott Wave Forecast.
Author

Elliott Wave Forecast Team
ElliottWave-Forecast.com


