Weekly waves: EUR/USD, GBP/USD and Bitcoin
-
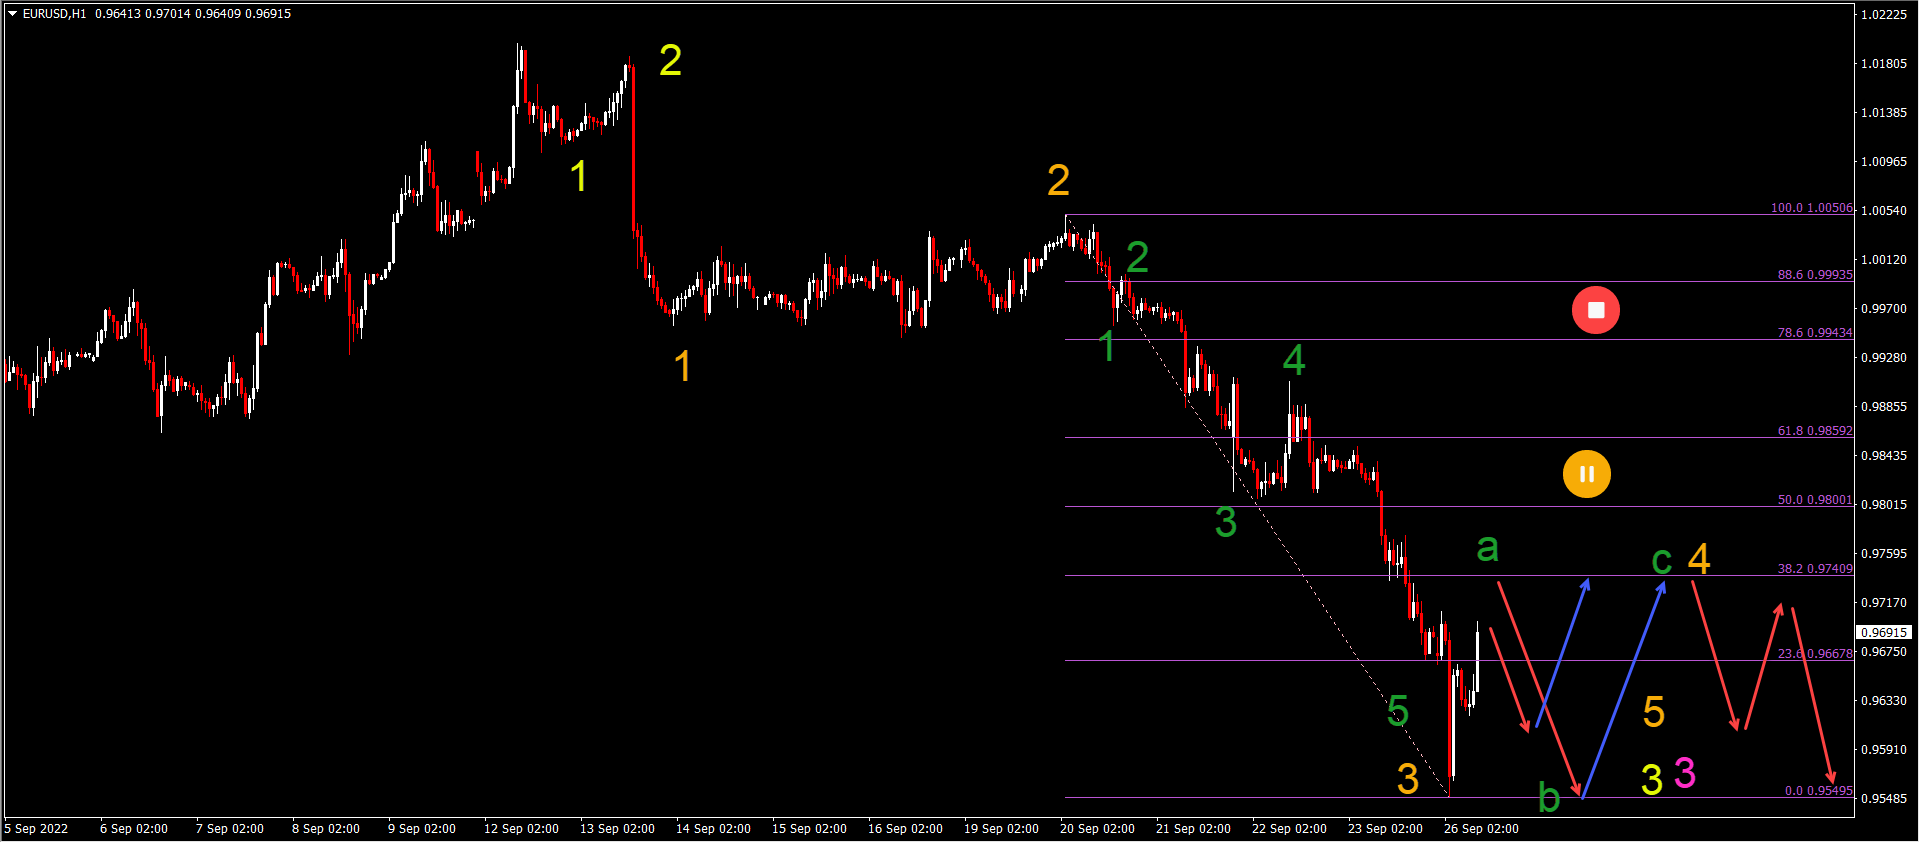
The EUR/USD almost reached 0.95 in early trading this morning, completing a wave 5 (green) of wave 3 (orange).
-
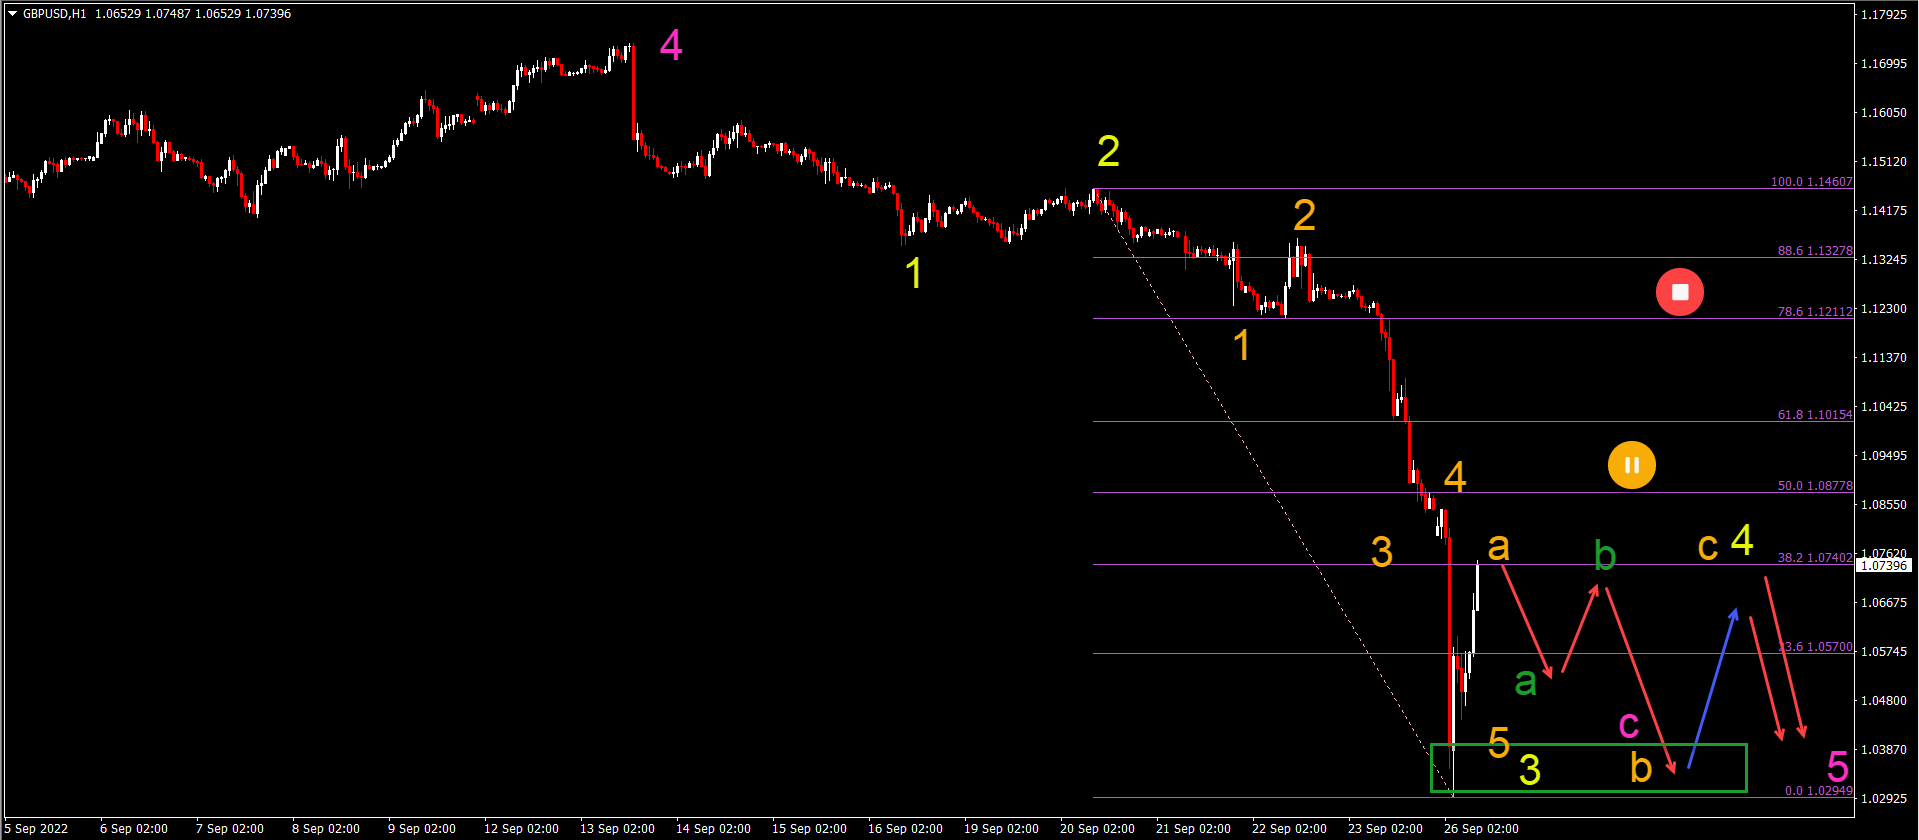
The GBP/USD made a huge drop from 1.0850 down to 1.03 earlier this morning, which seems to be part of an impulsive wave 3 (yellow).
-
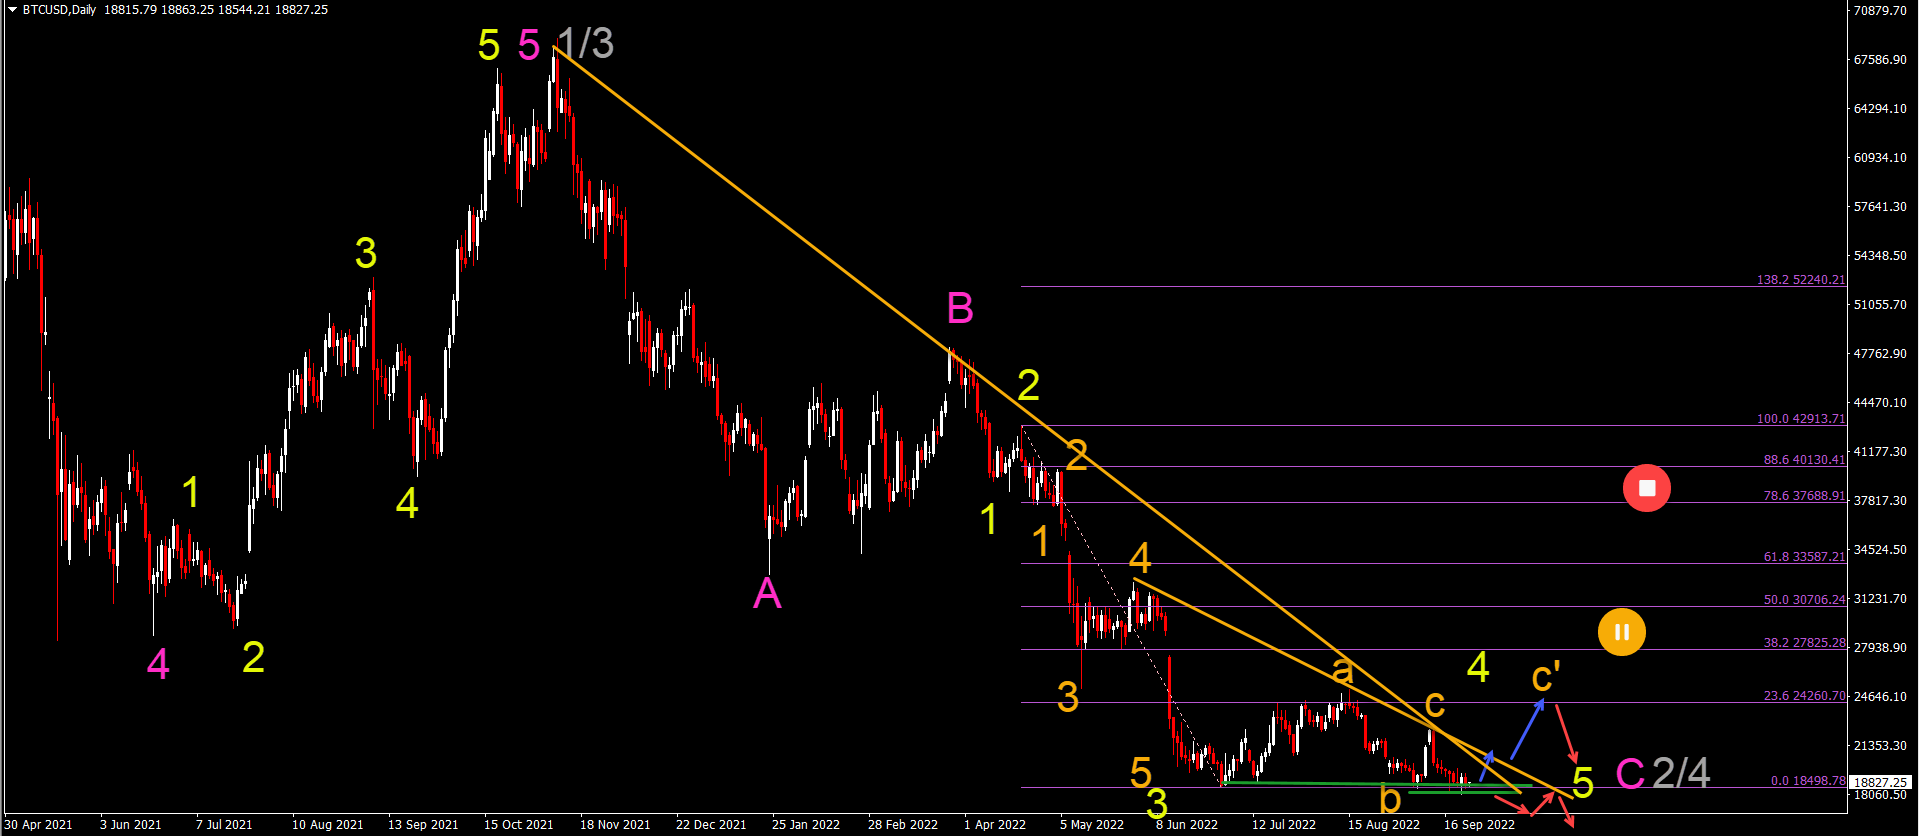
The BTC/USD is at an important decision zone: a bearish breakout confirms the downtrend (red arrows).

EUR/USD bearish impulse takes a small break
The EUR/USD almost reached 0.95 in early trading this morning:
-
The EUR/USD could have completed wave 5 (green) of wave 3 (orange).
-
The strong bullish bounce once price action reached the strong support at the 0.95 round level probably is a wave A (green) retracement.
-
Price action could face difficulties to move much higher. The Fibonacci retracement levels should act as a strong resistance.
-
A bearish reaction at the Fibonacci levels could confirm the end of wave A and the start of wave B (green).
-
A larger ABC (green) pattern would fit within an expected wave 4 (orange).
-
A downtrend is expected to resume and take price action at 0.94 and 0.9250 within wave 5 (orange) of waves 3.
GBP/USD crashes 550 pips in early trading
The GBP/USD made a huge drop from 1.0850 down to 1.03 earlier this morning:
-
The GBP/USD 550 pip decline this morning seems to be part of an impulsive wave 3 (yellow).
-
The strong bullish push upwards after the decline is expected to be a wave A (orange) of a larger ABC (orange) within a wave 4 (yellow).
-
The Fibonacci levels are expected to be a resistance zone.
-
A break above the 50% Fibonacci level makes it less likely that the current Elliott Wave analysis - indicating a wave 3 and 4 (yellow) - is correct.
-
A bullish ABC (orange) is expected within the wave 4 (yellow).
-
A downtrend continuation should aim at parity (1.00).
BTC/USD
Bitcoin (BTC/USD) is unable to break through the previous bottom (green lines):
-
The BTC/USD is at an important decision zone: a bearish breakout confirms the downtrend (red arrows).
-
A bullish bounce (blue arrows) could indicate a larger wave C (orange C’) towards the 23.6% and 38.2% Fibonacci resistance zone.
-
A break above the 38.2-50% Fibonacci levels could indicate that the wave 5 (yellow) of wave C (pink) has been completed.
-
A bearish bounce at the Fibonacci resistance levels should signal the end of the wave 4 (yellow).
-
A downtrend continuation aims at $15k and $12.5k within wave C (pink).
The analysis has been done with the indicators and template from the SWAT method simple wave analysis and trading. For more daily technical and wave analysis and updates, sign-up to our newsletter
Author

Chris Svorcik
FS method
Chris Svorcik is a trader, analyst, and educator with over 15 years of experience in financial markets, specializing in moving averages, market structure, and price patterns.


