Weekly waves: EUR/USD, GBP/USD and Bitcoin
-
Our weekly Elliott Wave analysis reviews the EUR/USD monthly chart, the GBP/USD 4 hour chart, and the Bitcoin crypto currency weekly chart.
-
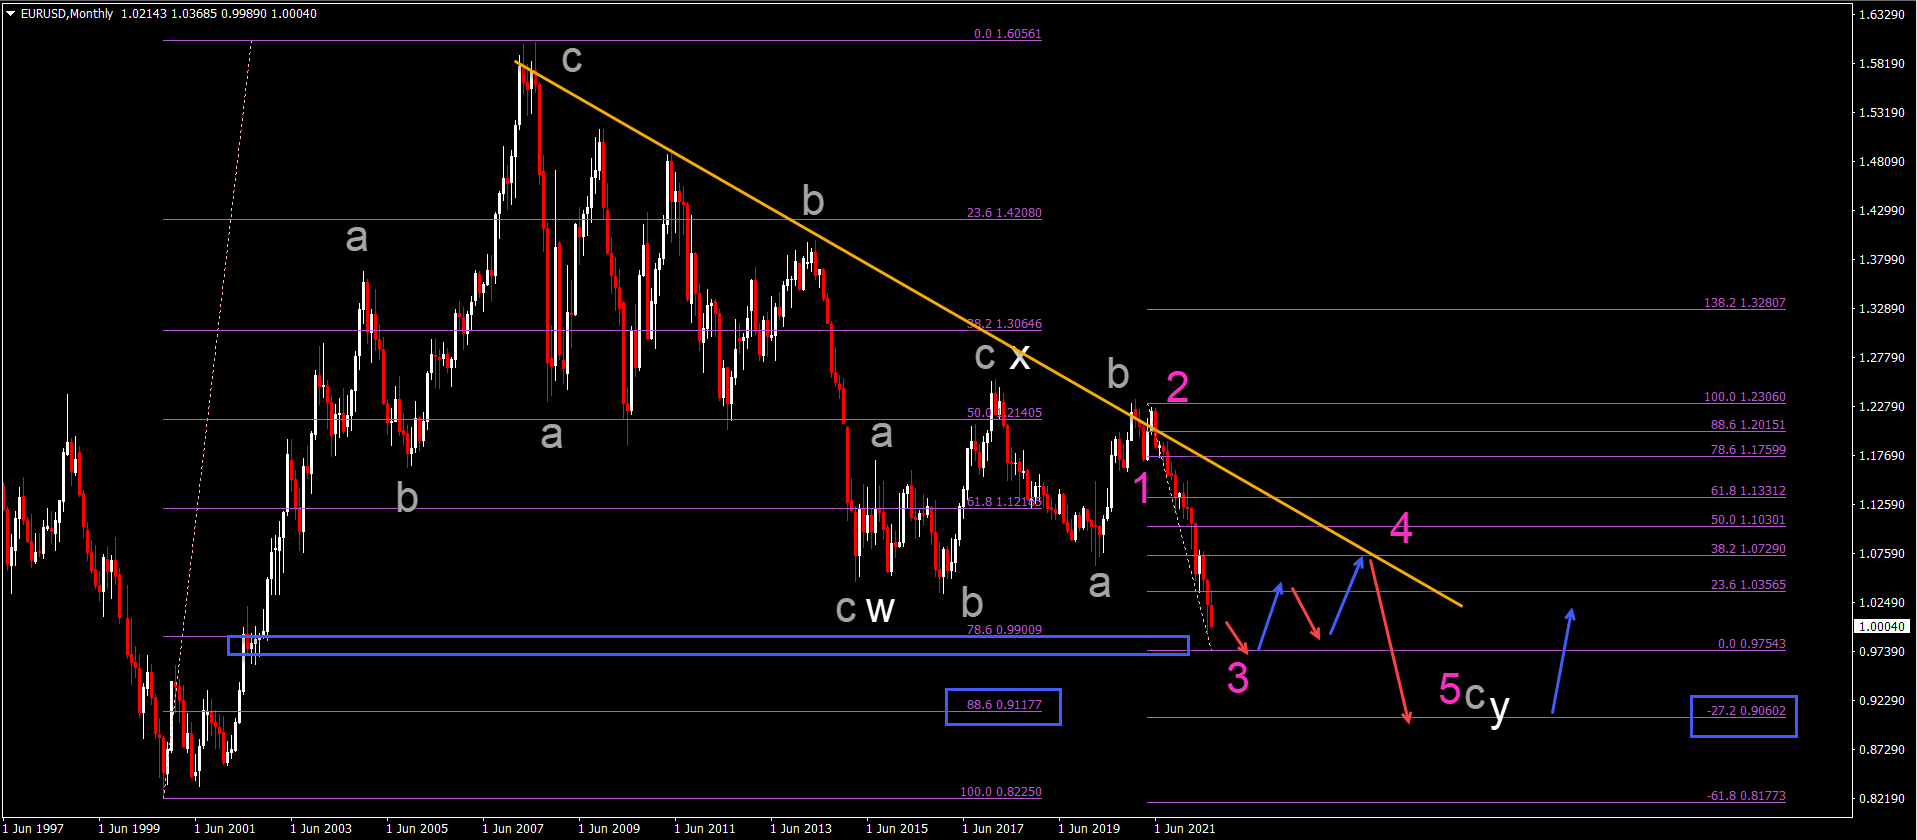
The EUR/USD is expected to decline further but a larger support zone and 78.6% Fibonacci level (blue box) could stop the downtrend around 0.9750.
-
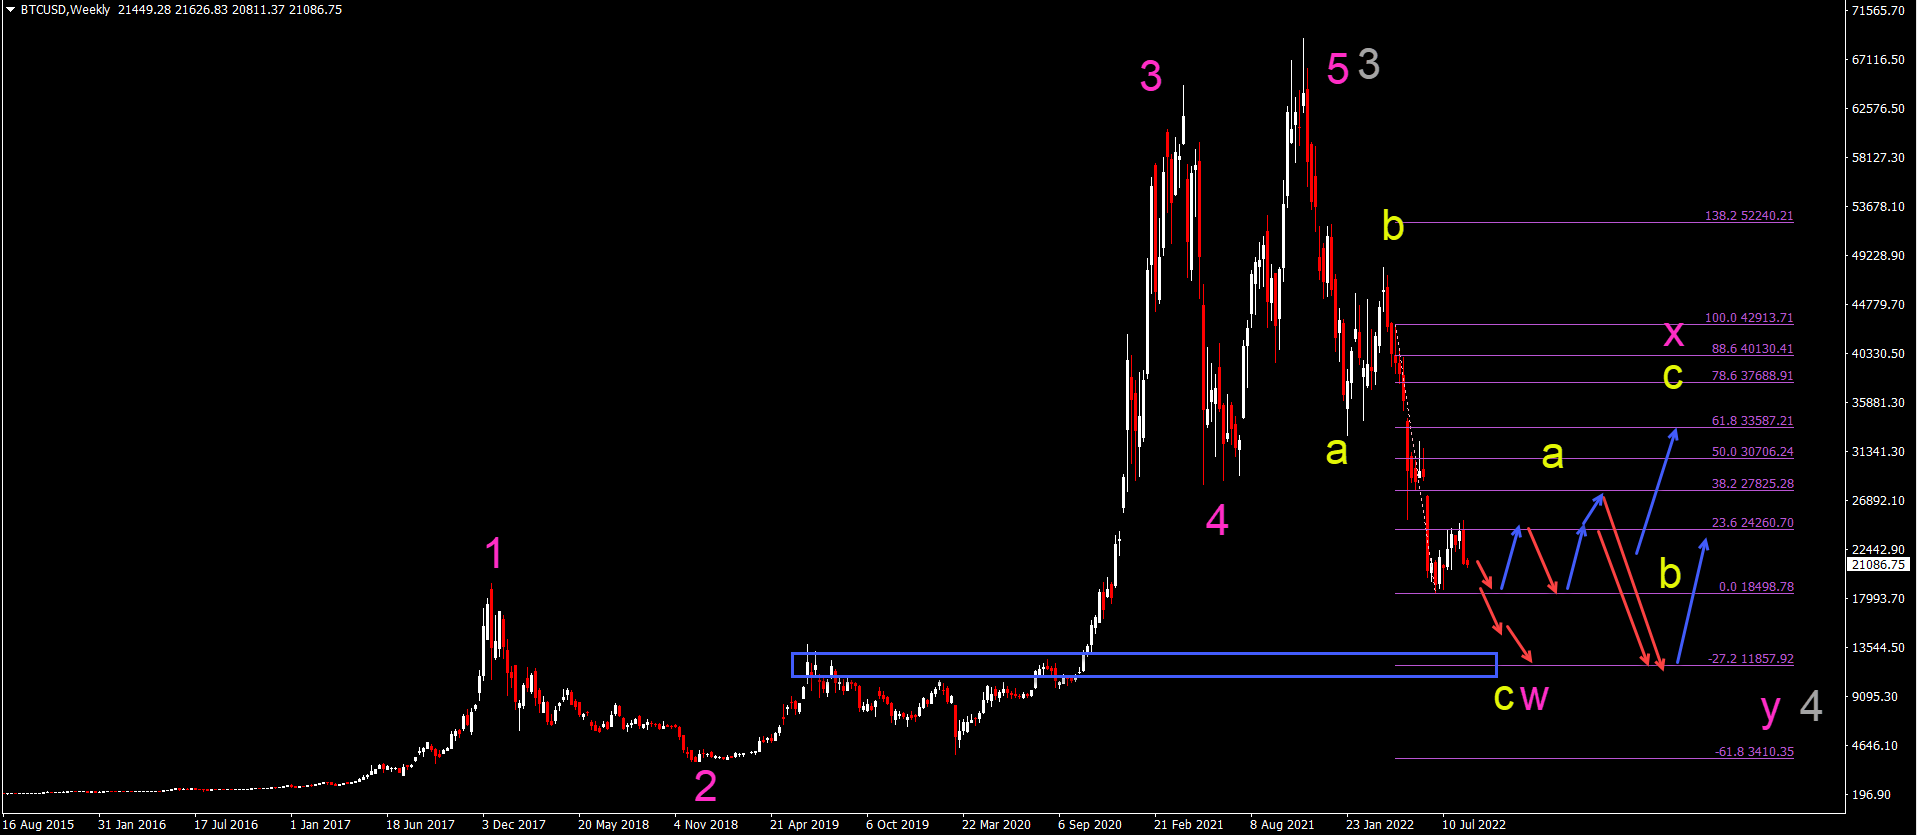
BTC/USD bearish breakout below the previous bottom (red arrows) indicates a downtrend continuation towards targets at $15k and $12.5k.

EUR/USD testing key support aone at 0.9750
The EUR/USD is testing again the key parity (1.00) level:
-
A bullish reaction at the support zone could indicate a larger bullish correction within the wave 4 (pink).
-
The bullish rebound could take price back up the 23.6% and 38.2 Fibonacci retracement levels plus resistance trend line.
-
Eventually a bearish continuation is expected towards the 88.6% Fibonacci retracement level and -27.2% Fibonacci target.
-
A bearish breakout below the support 0.9750 indicates an immediate continuation lower.
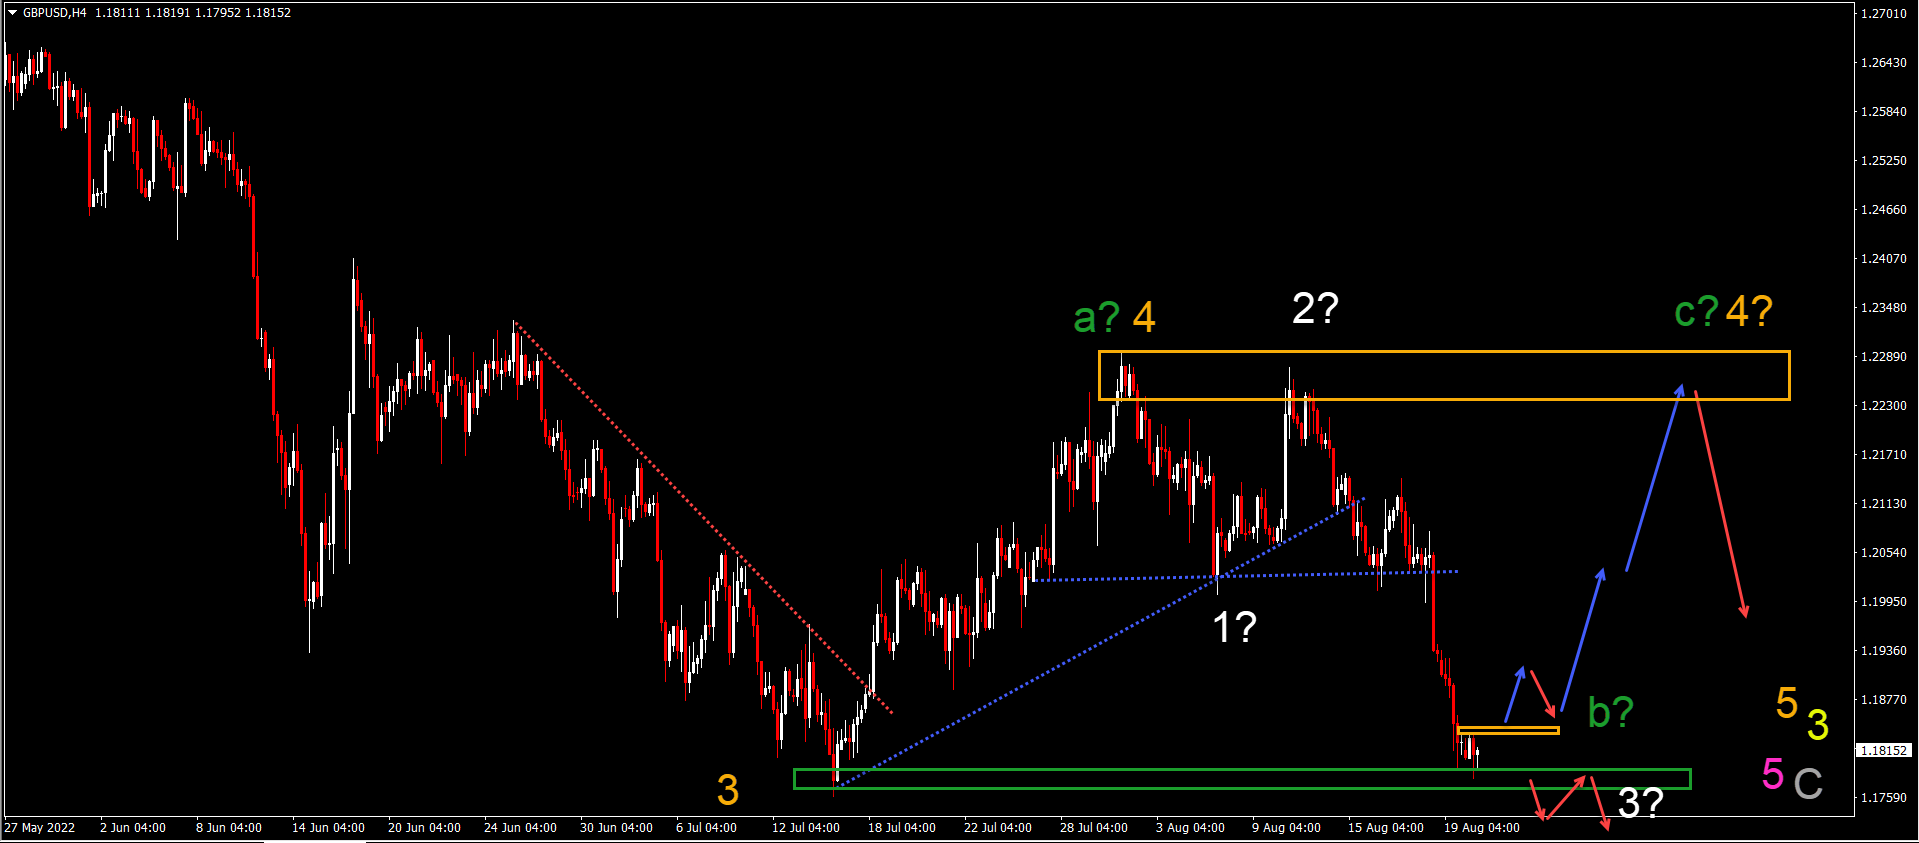
GBP/USD testing critical bottom and support
The GBP/USD is testing the previous bottom:
-
The GBP/USD is testing a key support zone (green box). A bullish breakout above the resistance zone (orange) could indicate a rally (blue arrows) towards the previous top (orange box).
-
In that case, price action is probably building an ABC (green) pattern in wave 4 (orange). A bearish breakout (red arrows) below the support (green box) could indicate an immediate downtrend towards 1.16 and 1.15.
-
In that case, price action is probably building a wave 123 (white) impulse.
BTC/USD wave patterns indicate consolidation
Bitcoin (BTC/USD) is building a bullish retracement but price action is struggling to find any substantial move up:
-
A bullish bounce at or above the previous bottom could indicate a sideways movement.
-
Price action could retrace upwards as high as the 38.2% Fibonacci retracement level but ultimately remain in a downtrend.
-
Eventually one more lower low is possible to complete a wave C (yellow) or finish a wave Y (pink).
-
A break above the 38.2% Fibonacci retracement level indicates a larger ABC (yellow) within wave Y (pink).
The analysis has been done with the indicators and template from the SWAT method simple wave analysis and trading. For more daily technical and wave analysis and updates, sign-up to our newsletter
Author

Chris Svorcik
FS method
Chris Svorcik is a trader, analyst, and educator with over 15 years of experience in financial markets, specializing in moving averages, market structure, and price patterns.


