Weekly waves: EUR/USD, Bitcoin, and US 30
-
Bitcoin seems to be highly correlated to the stock market. Many of the waves are the same and the US30 also is showing a completed five wave pattern in a wave one (or A) reversal.
-
Our Elliott Wave outlook indicates a downtrend continuation on the EUR/USD and the end of a bearish five wave pattern on both BTC/USD and the US30 stock market.
-
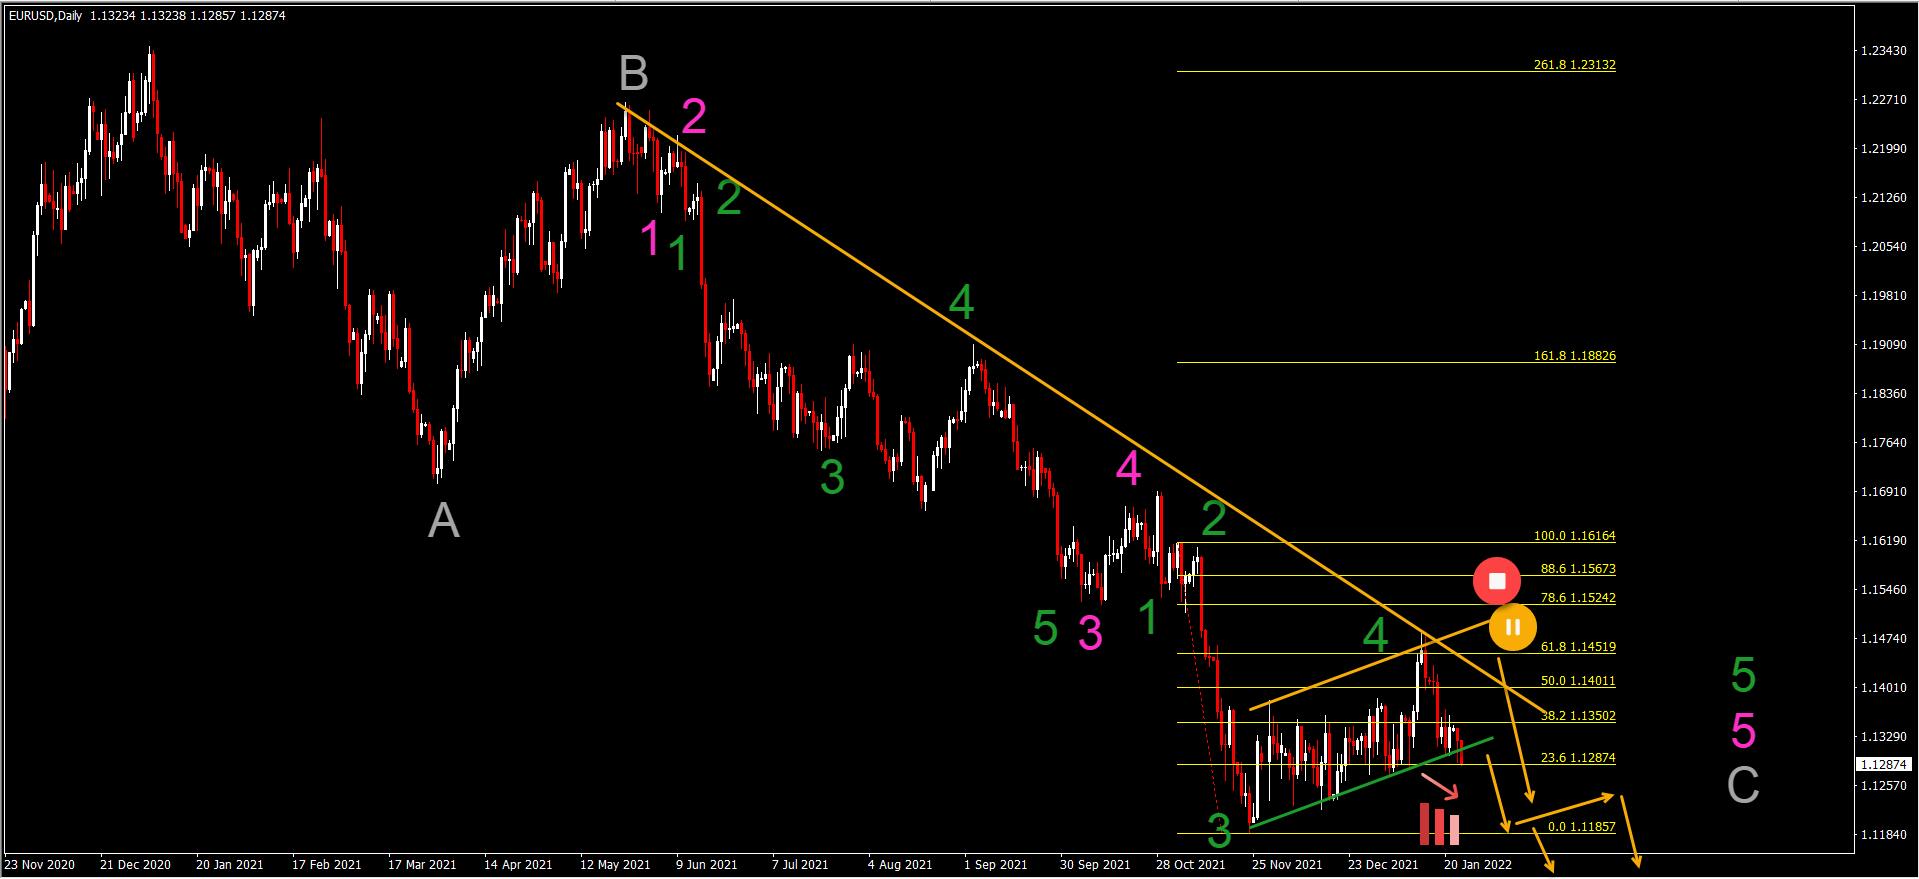
EUR/USD failed to make a bearish break below the bear flag pattern. But now price action has made a bearish bounce at the 61.8% Fib is and retesting the support again.

Our weekly analysis on Elliott Waves takes a close look at the EUR/USD, the Bitcoin crypto currency, and the US30 stock market.
EUR/USD retraces and bounces at 61.8% Fib resistance
The EUR/USD failed to make a bearish breakout below the bear flag chart pattern in the past 2 weeks. But now price action has made a bearish bounce at the 61.8% Fibonacci level and is retesting the support line again.
-
This time around, a bearish breakout seems likely. A daily candle close below the support trend line (green) would confirm the break.
-
The main target is the round level at 1.10. The bearish price swing could complete a wave 5 within wave 5 of wave C.
-
An unexpected bullish break above the 61.8% Fibonacci resistance would place this bear flag pattern on hold whereas a strong bullish move invalidates it (red circle).
-
The EUR/USD seems to be building an ABC (gray) pattern within a larger triangle pattern.
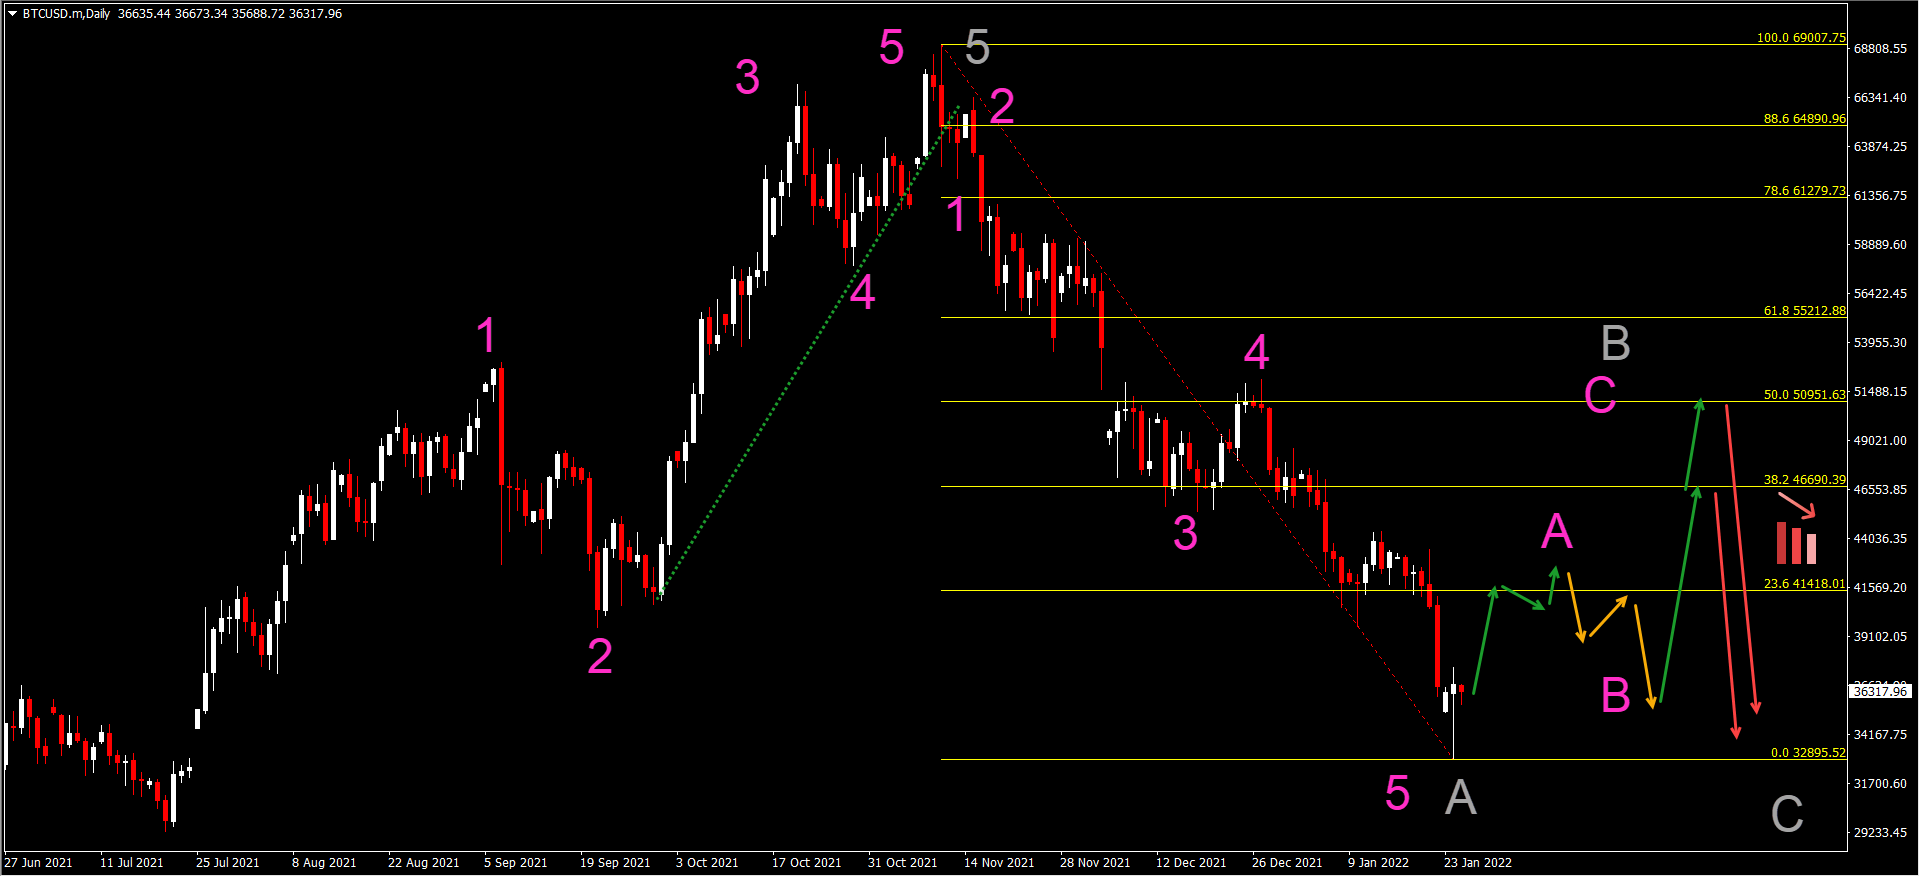
BTC/USD finished bearish wave A
The Bitcoin crypto pair (BTC/USD) has seen some hard hits in its price during recent weeks. Can it fall further?
-
The short answer is yes. The uptrend seems over and a strong and long bearish correction is expected according to our current Elliott Wave analysis.
-
However, a 5 wave bearish pattern seems to be completed. The bullish pinbar candlestick pattern could confirm a bullish reversal.
-
If price action does complete the bearish price swing, then price action has completed 5 waves (pink) in wave A (gray).
-
The next price swing should be an ABC (pink) pattern in the wave B (gray). After the ABC is completed, the wave C (gray) down should resume.
-
The main resistance levels of the wave B (gray) correspond to the 38.2% and 50% Fibonacci levels.
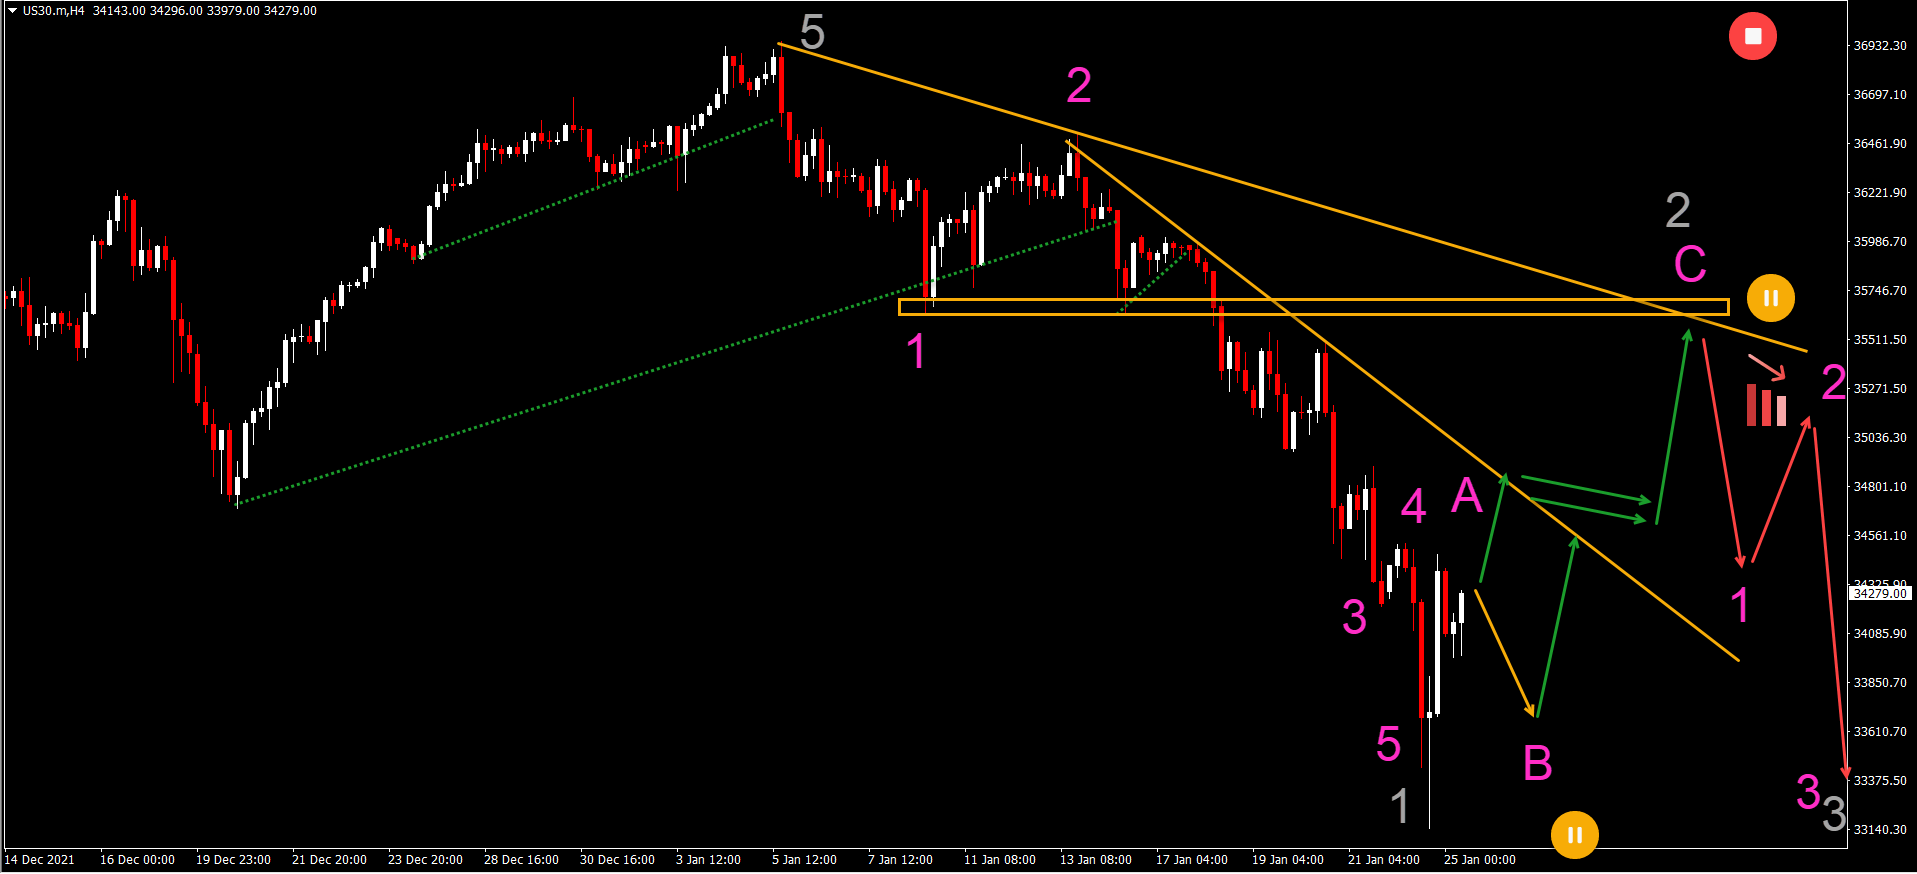
US30 also shows five bearish waves
Bitcoin seems to be highly correlated to the stock market. Many of the waves are the same and the US30 also is showing a completed 5 wave pattern in a wave 1 (or A) reversal:
-
5 waves (pink) seem completed in wave 1 (gray) or wave A.
-
A bullish ABC (pink) is expected in wave B (gray).
-
A bearish bounce at the resistance should end wave 2 and start wave C (gray).
-
A break below the bottom indicates a continued downtrend whereas a break above the resistance could indicate bullish strength.
The analysis has been done with the indicators and template from the SWAT method simple wave analysis and trading. For more daily technical and wave analysis and updates, sign-up to our newsletter.
Author

Chris Svorcik
FS method
Chris Svorcik is a trader, analyst, and educator with over 15 years of experience in financial markets, specializing in moving averages, market structure, and price patterns.


